ISA 1.0.0 – Iterative Signature Algorithm

ISA 1.0.0

:: DESCRIPTION

The ISA (Iterative Signature Algorithm) was designed to reduce the complexity of very large sets of data by decomposing it into so-called “modules”. In the context of gene expression data these modules consist of subsets of genes that exhibit a coherent expression profile only over a subset of microarray experiments. Genes and arrays may be attributed to multiple modules and the level of required coherence can be varied resulting in different “resolutions” of the modular mapping. Since the ISA does not rely on the computation of correlation matrices (like many other tools), it is extremely fast even for very large datasets.

::DEVELOPER

Computational Biology Group ,Department of Medical Genetics, University of Lausanne

:: SCREENSHOTS

N/A

:: REQUIREMENTS

:: DOWNLOAD

 ISA

:: MORE INFORMATION

Citation

Phys Rev E Stat Nonlin Soft Matter Phys. 2003 Mar;67(3 Pt 1):031902. Epub 2003 Mar 11.
Iterative signature algorithm for the analysis of large-scale gene expression data.
Bergmann S, Ihmels J, Barkai N.

ExpressionView 1.00 – Explore Biclusters Identified in Gene Expression data

ExpressionView 1.00

:: DESCRIPTION

ExpressionView is an R package that provides an interactive environment to explore biclusters identified in gene expression data. A sophisticated ordering algorithm is used to present the biclusters in a visually appealing layout. From this overview, the user can select individual biclusters and access all the biologically relevant data associated with it. The package is aimed to facilitate the collaboration between bioinformaticians and life scientists who are not familiar with the R language.

::DEVELOPER

Computational Biology Group ,Department of Medical Genetics, University of Lausanne

:: SCREENSHOTS

:: REQUIREMENTS

:: DOWNLOAD

 ExpressionView

:: MORE INFORMATION

Citation

ExpressionView–an interactive viewer for modules identified in gene expression data.
Lüscher A, Csárdi G, de Lachapelle AM, Kutalik Z, Peter B, Bergmann S.
Bioinformatics. 2010 Aug 15;26(16):2062-3. Epub 2010 Jul 29.

Cleaner 1.03 – Assembly of Informative, Transcript-specific Probe-clusters

Cleaner 1.03

:: DESCRIPTION

Cleaner: R-system software package for the assembly of informative, transcript-specific probe-clusters for Affymetrix expression microarrays.

::DEVELOPER

the Califano lab

:: SCREENSHOTS

N/A

:: REQUIREMENTS

:: DOWNLOAD

  Cleaner

:: MORE INFORMATION

HiDimViewer – Visualization tool for High-dimensional Datasets

HiDimViewer

:: DESCRIPTION

HiDimViewer is a visualization tool we are developing for high-dimensional datasets. It is designed to be used as an interactive data exploration tool to aid scientists in selecting and observing clusters in high-dimensional data.

::DEVELOPER

the UNC Computational Genetics Working Group

:: SCREENSHOTS

:: REQUIREMENTS

  • Windows

:: DOWNLOAD

 HiDimViewer

:: MORE INFORMATION

SICER 1.1 – Identification of Enriched Domains from Histone modification ChIP-Seq data

SICER 1.1

:: DESCRIPTION

SICER is a clustering approach for identification of enriched domains from histone modification ChIP-Seq data.

::DEVELOPER

Weiqun Peng

:: SCREENSHOTS

N/A

:: REQUIREMENTS

:: DOWNLOAD

 SICER

:: MORE INFORMATION

Citation

Chongzhi Zang, Dustin E. Schones, Chen Zeng, Kairong Cui, Keji Zhao, and Weiqun Peng,
A clustering approach for identification of enriched domains from histone modification ChIP-Seq data
Bioinformatics 25, 1952 – 1958 (2009)

Local Clustering – Find Timeshifted and/or Inverted Relationships in Gene Expression data

Local Clustering

:: DESCRIPTION

Local Clustering is a new algorithm for local clustering to find timeshifted and/or inverted relationships in gene expression data.

::DEVELOPER

Gerstein Lab

:: SCREENSHOTS

N/A

:: REQUIREMENTS

  • Linux
  • C Compiler

:: DOWNLOAD

 Local Clustering 

:: MORE INFORMATION

Citation:

J Qian, M Dolled-Filhart, J Lin, H Yu, M Gerstein (2001).
Beyond synexpression relationships: local clustering of time-shifted and inverted gene expression profiles identifies new, biologically relevant interactions.
J Mol Biol 314:1053-66.

Modk-Prototypes – Clusters Biological Samples

Modk-Prototypes

:: DESCRIPTION

Modk-Prototypes is a software for clusters biological samples by simultaneously considering microarray gene expression data and classes of known phenotypic variables such as clinical chemistry evaluations and histopathologic observations.

::DEVELOPER

Pierre R. Bushel, Ph.D.

:: SCREENSHOTS

N/A

:: REQUIREMENTS

:: DOWNLOAD

 Modk-Prototypes

:: MORE INFORMATION

Citation

BMC Syst Biol. 2007 Feb 23;1:15.
Simultaneous clustering of gene expression data with clinical chemistry and pathological evaluations reveals phenotypic prototypes.
Bushel PR, Wolfinger RD, Gibson G.

CurveSOM – Curve-based Custering of Time Course Expression data

CurveSOM

:: DESCRIPTION

CurveSOM is a new clustering algorithm of curve-based custering of time course expression data . It first present each gene by a cubic smoothing spline that is fitted to its time course expression data and then group genes into clusters by applying a self-organizing map-based clustering on the resulting splines. CurveSOM is a very promising tool for the exploratory analysis of time course expression data, as it is not only able to group genes into clusters with high accuracy but also able to find true time-shifted correlations of expression patterns between clusters.

::DEVELOPER

Chen Xin

:: SCREENSHOTS

N/A

:: REQUIREMENTS

  • Windows

:: DOWNLOAD

 CurveSOM

:: MORE INFORMATION

Citation

X. Chen.
Curve-based clustering of time course gene expression data using self-organizing maps.
Journal of Bioinformatics and Computational Biology, vol. 7, no. 4, 645-661, 2009..

LAS – Finding Large Average Submatricies in High Dimensional Data

LAS

:: DESCRIPTION

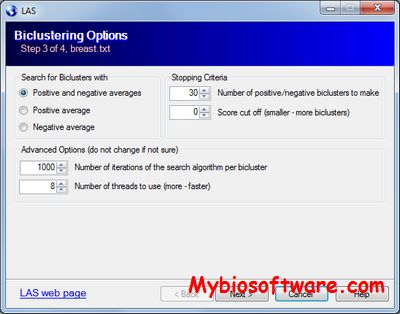
LAS (Large Average Submatricies) is a statistically motivated biclustering method that finds large average submatrices within a given real-valued data matrix

::DEVELOPER

Andrey A. Shabalin

:: SCREENSHOTS

::REQUIREMENTS

:: DOWNLOAD

 LAS

:: MORE INFORMATION

Citation

Andrey A. Shabalin et al.
Finding Large Average Submatricies in High Dimensional Data
Annals of Applied Statistics 2009, Vol. 3, No. 3, 985-1012

CLUSPECT 1.0 – Supervised spectral clustering

CLUSPECT 1.0

:: DESCRIPTION

CLUSPECT is a new clustering method applicable for microarray data (Tritchler et al, 2005). This paper introduces a clustering method for microarray data based on eigenanalysis. The method is computationally efficient and can be interpreted in terms of familiar statistical models. Using simulation studies, we demonstrated that our spectral clustering method outperformed the two most widely used clustering methods, namely hierarchical and k-means (Tritchler et al, 2005). For example, comparing truth with the outputs of k-means, spectral and hierarchical clustering for a moderately difficult clustering problem, we obtained average adjusted Rand indices of 0.77 for k-means, 0.74 for hierarchical and 0.98 for spectral. The adjusted Rand statistic that was used to compare the performance of the three clustering methods can range from 0 to 1, with 1 being perfect agreement. Our method can incorporate supervision, in order to produce clusters whose variation can predict clinical outcome.

::DEVELOPER

Sebastian Hirjoghe and David Tritchler

: SCREENSHOTS

N/A

:: REQUIREMENTS

:: DOWNLOAD

  CLUSPECT

:: MORE INFORMATION

Citation

Tritchler, D., Fallah, S., and Beyene, J. (2005).
A spectral clustering method for microarray data.
Computational Statistics and Data Analysis, 49:63-76.