ClusterViz 0.2 – Cluster Visualisation

ClusterViz 0.2

:: DESCRIPTION

ClusterViz is a software to visualize the clustering process using the family of k-means algorithms. ClusterViz allows to cluster data while visualizing an up to three dimensional projection. The clustering process is visualized using OpenGL. As clustering algorithms the family of k-means algorithms is implemented, including mixture models.

::DEVELOPER

Alexander Schliep’s group for bioinformatics

:: SCREENSHOTS

N/A

:: REQUIREMENTS

:: DOWNLOAD

 ClusterViz

:: MORE INFORMATION

MITree – Clusterin Algorithm based on a Straightforward Geometric principle

MITree

:: DESCRIPTION

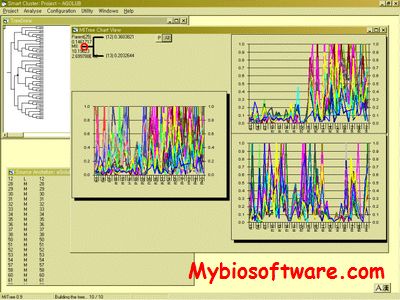
MITree is a clusterin algorithm based on a straightforward geometric principle. Initially it was designed to be a binary hierarchical clustering algorithm for gene expression analysis.

::DEVELOPER

SNUBI

:: SCREENSHOTS

:: REQUIREMENTS

  • Windows

:: DOWNLOAD

 MITree

:: MORE INFORMATION

Citation

Kim JH, Ohno-Machado L, Kohane IS.
Unsupervised learning from complex data: the matrix incision tree algorithm.
Pac Symp Biocomput 2001;:30-41.


FunCluster 1.07 – Functional Analysis of Gene Expression data

FunCluster 1.07

:: DESCRIPTION

FunCluster is a genomic data analysis tool designed to perform a functional analysis of gene expression data obtained from cDNA microarray experiments. Besides automated functional annotation of gene expression data, FunCluster functional analysis allows to detect co-regulated biological processes (i.e. represented by annotating genomic themes) through a specifically designed co-clustering procedure involving biological annotations and gene expression data. FunCluster’s functional analysis relies on Gene Ontology and KEGG annotations and is currently available for three organisms: Homo sapiens, Mus musculus and Saccharomyces cerevisiae.

::DEVELOPER

 Corneliu Henegar

:: SCREENSHOTS

N/A

:: REQUIREMENTS

:: DOWNLOAD

  FunCluster

:: MORE INFORMATION

Citation

Clustering biological annotations and gene expression data to identify putatively co-regulated biological processes
Henegar C, Cancello R, Rome S, Vidal H, Clement K, Zucker JD
J Bioinform Comput Biol. 2006 Aug;4(4):833-52.


CLENCH 2.0 – Calculate Cluster Enrichment using the Gene Ontology

CLENCH 2.0

:: DESCRIPTION

CLENCH is a program for calculating cluster enrichment using the Gene Ontology. Analysis of microarray data most often produces lists of genes with similar expression patterns, which are then subdivided into functional categories for biological interpretation. Such functional categorization is most commonly accomplished using Gene Ontology (GO) categories. Although there are several programs that identify and analyze functional categories for human, mouse and yeast genes none, of them accept Arabidopsis thaliana data. In order to address this need for A. thaliana community, we have developed a program that retrieves GO annotations for A. thaliana genes and performs functional category analysis for lists of genes selected by the user.

::DEVELOPER

Nigam Shah

:: SCREENSHOTS

N/A

:: REQUIREMENTS

  • Linux / Windows /MacOsX
  • perl

:: DOWNLOAD

  CLENCH

:: MORE INFORMATION

Citation

Bioinformatics. 2004 May 1;20(7):1196-7. Epub 2004 Feb 5.
CLENCH: a program for calculating Cluster ENriCHment using the Gene Ontology.
Shah NH, Fedoroff NV.


Mosclust 1.0 – Discovery of Significant Structures in Bio-molecular data

Mosclust 1.0

:: DESCRIPTION

The mosclust R package (that stands for model order selection for clustering problems) implements a set of functions to discover significant structures in bio-molecular data. One of the main problems in unsupervised clustering analysis is the assessment of the “natural” number of clusters. Several methods and software tools have been proposed to tackle this problem

::DEVELOPER

Giorgio Valentini

:: SCREENSHOTS

N/A

:: REQUIREMENTS

:: DOWNLOAD

 Mosclust

:: MORE INFORMATION

Citation

Bioinformatics. 2007 Feb 1;23(3):387-9. Epub 2006 Nov 24.
Mosclust: a software library for discovering significant structures in bio-molecular data.
Valentini G.

Clusterv 1.1 – Cluster Validation

Clusterv 1.1

:: DESCRIPTION

The clusterv R package implements a set of functions to assess the reliability of clusters discovered by clustering algorithms. This library is tailored to the analysis of high dimensional data and in particular it is conceived for the analysis of the reliability of clusters discovered using DNA microarray data.

::DEVELOPER

Giorgio Valentini

:: SCREENSHOTS

N/A

:: REQUIREMENTS

:: DOWNLOAD

 Clusterv

:: MORE INFORMATION

Citation

Bioinformatics. 2006 Feb 1;22(3):369-70. Epub 2005 Dec 6.
Clusterv: a tool for assessing the reliability of clusters discovered in DNA microarray data.
Valentini G.


COMUSA – Combining Multiple Clusterings Using Similarity Graph

COMUSA

:: DESCRIPTION

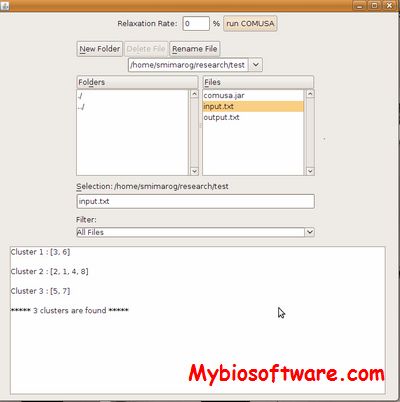
COMUSA is a software for combining the benefits of a collection of clusterings into a final clustering having better overall quality.COMUSA implementation is compared with PMETIS, KMETIS, and k-means. Experimental results on artificial, real, and biological data sets demonstrate the effectiveness of our method. COMUSA produces very good quality clusters in a short amount of time.

::DEVELOPER

Selim Mimaroglu , Ertunc Erdil

:: SCREENSHOTS

:: REQUIREMENTS

  • Linux/Windows / MacOsX
  • Java

:: DOWNLOAD

  COMUSA

:: MORE INFORMATION

Citation:

Bioinformatics. 2010 Oct 15;26(20):2645-6. Epub 2010 Aug 24.
Obtaining better quality final clustering by merging a collection of clusterings.
Mimaroglu S, Erdil E.

relax_bicluster – Bicluster based the Probabilistic Relaxation Labeling Framework

relax_bicluster

:: DESCRIPTION

relax_bicluster is a biclustering algorithm based the probabilistic relaxation labeling framework for discovering geometric biclusters of gene expression data.

::DEVELOPER

 Hong Yan , Signal Processing Lab at City University of Hong Kong

:: SCREENSHOTS

N/A

:: REQUIREMENTS

:: DOWNLOAD

 relax_bicluster

:: MORE INFORMATION

Citation:

Hongya Zhao et al.
A probabilistic relaxation labeling framework for reducing the noise effect in geometric biclustering of gene expression data
Journal Pattern Recognition Volume 42 Issue 11, November, 2009 Pages 2578-2588

CLUTO 2.1.2a / gCLUTO 1.0 – Software for Clustering High-Dimensional Datasets

CLUTO 2.1.2a / gCLUTO 1.0

:: DESCRIPTION

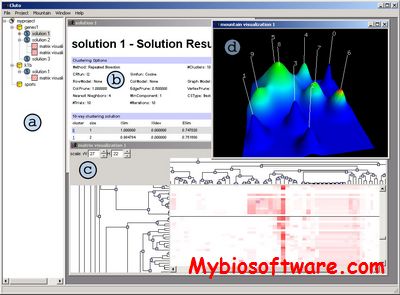
CLUTO is a software package for clustering low- and high-dimensional datasets and for analyzing the characteristics of the various clusters. CLUTO is well-suited for clustering data sets arising in many diverse application areas including information retrieval, customer purchasing transactions, web, GIS, science, and biology.

gCLUTO is a cross-platform graphical application for clustering low- and high-dimensional datasets and for analyzing the characteristics of the various clusters.

::DEVELOPER

Karypis Lab

:: SCREENSHOTS

:: REQUIREMENTS

  • Linux/ Windows

:: DOWNLOAD

 CLUTO  / gCLUTO

:: MORE INFORMATION

Citation:

Matt Rasmussen and George Karypis.
gCLUTO: An Interactive Clustering, Visualization, and Analysis System.
UMN-CS TR-04-021, 2004.

COGRIM – Clustering of Genes into Regulons using Integrated Modeling

COGRIM

:: DESCRIPTION

COGRIM is an R program of Bayesian hierarchical model and Gibbs Sampling implementation that integrates gene expression, ChIP binding, and transcription factor motif data in a principled and robust fashion.

::DEVELOPER

the Computational Biology and Informatics Laboratory (in the Center for Bioinformatics at the University of Pennsylvania)

:: SCREENSHOTS

N/A

:: REQUIREMENTS

:: DOWNLOAD

 COGRIM

:: MORE INFORMATION

Citation:

G. Chen, S. T. Jensen, C. Stoeckert,
Clustering of Genes into Regulons using Integrated Modeling-COGRIM“,
Genome Biology, 2007, Jan. 4;8(1):R4