Pedimap 2.1 – Genetic & Phenotypic Data Visualization

Pedimap 2.1

:: DESCRIPTION

Pedimap is software designed to graphically present genetic information in pedigrees. This information can include phenotypic data, observed marker alleles, calculated Identity by Descent (IBD) probabilities, and (to be added) QTL (Quantitative Trait Loci) allele probabilities.

Pedimap is unique among other things in its capability to present some of this information in relation to genetic linkage maps, hence the name.

::DEVELOPER

dr. RE (Roeland) Voorrips

:: SCREENSHOTS

:: REQUIREMENTS

  • Windows

:: DOWNLOAD

Pedimap

:: MORE INFORMATION

Citation
Voorrips RE, Bink MC, van de Weg WE.
Pedimap: Software for visualization of genetic and phenotypic data in pedigrees.
J Hered. 2012 Nov-Dec;103(6):903-7.

AutoDock 4.2.6 / AutoDockTools 1.5.6 – Suite of Automated Docking Tools

AutoDock 4.2.6

:: DESCRIPTION

AutoDock is a suite of automated docking tools. It is designed to predict how small molecules, such as substrates or drug candidates, bind to a receptor of known 3D structure.

AutoDockTools (ADT) is graphical front-end for setting up and running AutoDock – an automated docking software designed to predict how small molecules, such as substrates or drug candidates, bind to a receptor of known 3D structure.

::DEVELOPER

The Center for Computational Structural Biology (CCSB) , The Scripps Research Institute

:: SCREENSHOTS

:: REQUIREMENTS

  • Windows / MacOsX /  Linux

:: DOWNLOAD

AutoDock , AutoDockTools

:: MORE INFORMATION

Citation

Morris,G. M., Huey, R., Lindstrom, W., Sanner, M. F., Belew, R. K., Goodsell, D. S. and Olson, A. J. (2009)
Autodock4 and AutoDockTools4: automated docking with selective receptor flexiblity.
J.Comput.Chem. 2009 Dec;30(16):2785-91.

MapChart 2.32 – Graphical Presentation of Linkage Maps and QTLs

MapChart 2.32

:: DESCRIPTION

MapChart is a Windows software for the graphical presentation of linkage maps and QTLs. These charts are composed of a sequence of vertical bars representing the linkage groups or chromosomes. On these bars the positions of loci are indicated, and next to the bars QTL intervals and QTL graphs can be shown. MapChart reads the linkage information (i.e. the locus and QTL names and their positions) from text files.

::DEVELOPER

dr. RE (Roeland) Voorrips

:: SCREENSHOTS

N/A

:: REQUIREMENTS

  • Windows

:: DOWNLOAD

  MapChart

:: MORE INFORMATION

Citation:

Voorrips, R.E., 2002.
MapChart: Software for the graphical presentation of linkage maps and QTLs.
The Journal of Heredity 93 (1): 77-78.

RNAstructure 6.6 – Prediction & Analysis of RNA Secondary Structure

RNAstructure 6.6

:: DESCRIPTION

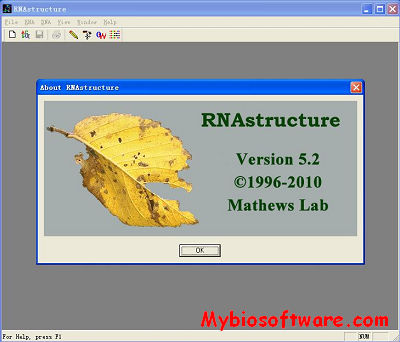
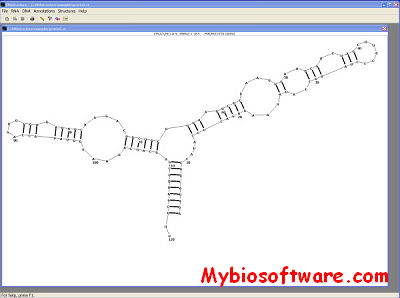
RNAstructure is a complete package for RNA and DNA secondary structure prediction and analysis. It includes algorithms for secondary structure prediction, including facility to predict base pairing probabilities. It also can be used to predict bimolecular structures and can predict the equilibrium binding affinity of an oligonucleotide to a structured RNA target. This is useful for siRNA design. It can also predict secondary structures common to two, unaligned sequences, which is much more accurate than single sequence secondary structure prediction. Finally, RNAstructure can take a number of different types of experiment mapping data to constrain or restrain structure prediction. These include chemical mapping, enzymatic mapping, NMR, and SHAPE data.

::DEVELOPER

Mathews Lab

:: SCREENSHOTS

:: REQUIREMENTS

  • Linux / Mac / Windows
  • Java

:: DOWNLOAD

RNAstructure

:: MORE INFORMATION

Citation

AccessFold: Predicting RNA-RNA Interactions with Consideration for Competing Self-Structure.
DiChiacchio L, Sloma MF, Mathews DH.
Bioinformatics. 2015 Nov 20. pii: btv682.

Reuter, J. S., & Mathews, D. H. (2010).
RNAstructure: software for RNA secondary structure prediction and analysis.
BMC Bioinformatics. 11,129.

PedigreeSim 2.2 – Simulation of Genotypes in Pedigrees of Diploid and Tetraploid Species

PedigreeSim 2.2

:: DESCRIPTION

PedigreeSim is software that generates simulated genetic marker data of individuals in pedigreed populations. A population can consist of either diploid or tetraploid individuals. PedigreeSim can simulate meioses with or without chiasma interference, and in tetraploids it can simulate meioses with two bivalents or one quadrivalent per set of hom(oe)ologous chromosomes. Also varying probabilities of preferential versus random pairing of chromosomes can be simulated, allowing to simulate amphidiploids as well as autotetraploids and intermediate forms.

::DEVELOPER

Wageningen UR Plant Breeding

:: SCREENSHOTS

N/A

:: REQUIREMENTS

  • Windows/ MacOsX / Linux
  • Java

:: DOWNLOAD

 PedigreeSim

:: MORE INFORMATION

Citation

Voorrips RE, Maliepaard CA (2012)
The simulation of meiosis in diploid and tetraploid organisms using various genetic models.
BMC Bioinformatics. 2012 Sep 26;13:248.

BioMercator v4.2.3 – Genetic Maps and QTL Integration

BioMercator v4.2.3

:: DESCRIPTION

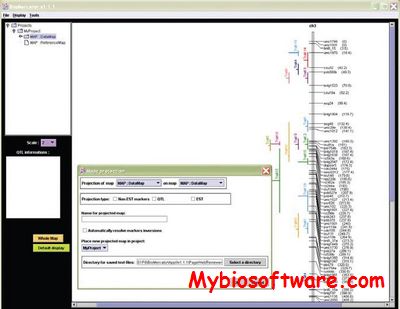
BioMercator is a standalone application for: (1) Displaying genetic maps and QTL through a graphical user interface. (2) Performing automatic compilations of several genetic maps through a projection process. (3) Computing meta-analysis of QTL detected in independent experiments.

:: DEVELOPER

ABI Bioinformatic and Informatic Team 

:: SCREENSHOTS

:: REQUIREMENTS

:: DOWNLOAD

 BioMercator

:: MORE INFORMATION

Citation:

Arcade A, Labourdette A, Falque M, Mangin B, Chardon F, Charcosset A, Joets J.
BioMercator: integrating genetic maps and QTL towards discovery of candidate genes.
Bioinformatics. (2004) Sep 22;20(14):2321-6.

Olivier Sosnowski, Alain Charcosset and Johann Joets.
 BioMercator V3: an upgrade of genetic map compilation and QTL meta-analysis algorithms
Bioinformatics. 2012 Aug 1;28(15):2082-3. doi: 10.1093/bioinformatics/bts313.

MEGA 12.1 – Molecular Evolutionary Genetics Analysis

MEGA 12.1

:: DESCRIPTION

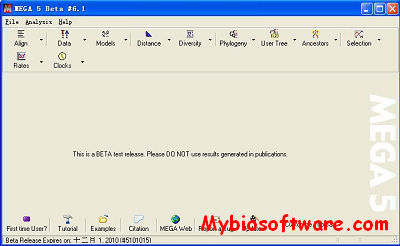
MEGA (Molecular Evolutionary Genetics Analysis)is an integrated tool for automatic and manual sequence alignment, inferring phylogenetic trees, mining web-based databases, estimating rates of molecular evolution, and testing evolutionary hypotheses.

::DEVELOPER

MEGA Team

:: SCREENSHOTS

:: REQUIREMENTS

  • Windows / Linux / MacOSX

:: DOWNLOAD

MEGA

:: MORE INFORMATION

Citation

Mol Biol Evol. 2013 Dec;30(12):2725-9. doi: 10.1093/molbev/mst197. Epub 2013 Oct 16.
MEGA6: Molecular Evolutionary Genetics Analysis version 6.0.
Tamura K, Stecher G, Peterson D, Filipski A, Kumar S.

Tamura K, Peterson D, Peterson N, Stecher G, Nei M, and Kumar S (2011)
MEGA5: Molecular Evolutionary Genetics Analysis using Maximum Likelihood, Evolutionary Distance, and Maximum Parsimony Methods.
Molecular Biology and Evolution (2011)doi: 10.1093/molbev/msr121 First published online: May 4, 2011

DARwin 6.0.021 – Diversity and Phylogenetic Analysis

DARwin 6.0.021

:: DESCRIPTION

DARwin (Dissimilarity Analysis and Representation for Windows) is a software package developed for diversity and phylogenetic analysis on the basis of evolutionary dissimilarities.

::DEVELOPER

DARwin Team

:: SCREENSHOTS

:: REQUIREMENTS

  • Windows

:: DOWNLOAD

 DARwin

:: MORE INFORMATION

Citation:

Perrier, X., Flori, A. , Bonnot, F. (2003). Data analysis methods.
In: Hamon, P., Seguin, M., Perrier, X. ,Glaszmann, J. C. Ed., Genetic diversity of cultivated tropical plants. Enfield, Science Publishers. Montpellier. pp 43 – 76.

HyperTree 1.2.2 – Java Phylogenetic Tree Viewer

HyperTree 1.2.2

:: DESCRIPTION

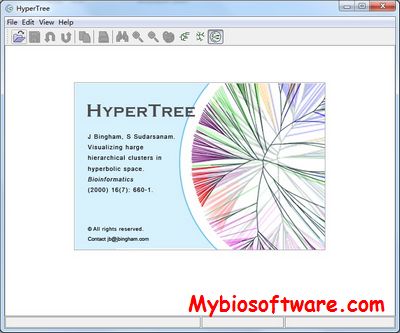
HYPERTREE is a Java phylogenetic tree viewer, with a hyperbolic (‘fish-eye’) view and editing abilities that help in managing very large trees.

::DEVELOPER

kinase.com

:: SCREENSHOTS

:: REQUIREMENTS

  • Linux / Windows / Mac OsX
  • Java

:: DOWNLOAD

 HyperTree

:: MORE INFORMATION

Citation

Visualizing harge hierarchical clusters in hyperbolic space
J. Bingham, S Sudarsanam
Bioinformatics (2000) 16(7): 660-1

VESTA 3.90.5a – 3D Visualization System for Electronic & Structural Analysis

VESTA 3.90.5a

:: DESCRIPTION

VESTA (Visualization System for Electronic & Structural Analysis) is a 3D visualization program for structural models and 3D grid data such as electron/nuclear densities. Some of the novel features of VESTA are listed below.

::DEVELOPER

Koichi Momma

:: SCREENSHOTS

:: REQUIREMENTS

  • Windows/Linux/MacOsX

:: DOWNLOAD

 VESTA

:: MORE INFORMATION

Citation

K. Momma and F. Izumi,
“VESTA: a three-dimensional visualization system for electronic and structural analysis,”
J. Appl. Crystallogr., 41:653-658, 2008.