POPGENE 1.32 – Population Genetic Analysis

POPGENE 1.32

:: DESCRIPTION

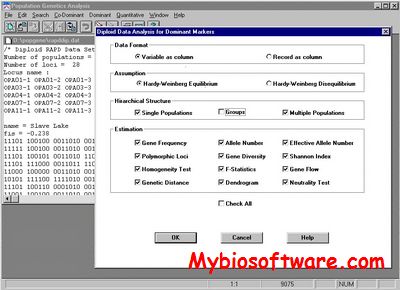
POPGENE is a user-friendly computer freeware for the analysis of genetic variation among and within populations using co-dominant and dominant markers. This package provides the Windows graphical user interface that makes population genetics analysis more accessible for the casual computer user and more convenient for the experienced computer user. Simple menus and dialog box selections enable you to perform complex analyses and produce scientifically sound statistics, thereby assisting you to adequately analyze population genetic structure using the target markers.

::DEVELOPER

POPGENE Team

:: SCREENSHOTS

:: REQUIREMENTS

  • Windows

:: DOWNLOAD

 POPGENE

:: MORE INFORMATION

Breeder 3.0 – Plant Breeding Game

Breeder 3.0

:: DESCRIPTION

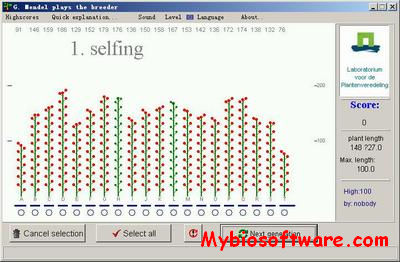
Breeder is an entertaining plant breeding game, that puts you in the position of the breeder that has to make selection with a limited amount of resources. Can you obtain the tallest plants with the right color.

The engine of the game is a realistic (Mendelian) genetic model with linkage and recombination, topped off with some random noise.

::DEVELOPER

The expertise group Plant Breeding

:: SCREENSHOTS

:: REQUIREMENTS

  • Windows

:: DOWNLOAD

Breeder

:: MORE INFORMATION

Flapjack 1.22.04.21 – Graphical Genotype Visualization

Flapjack 1.22.04.21

:: DESCRIPTION

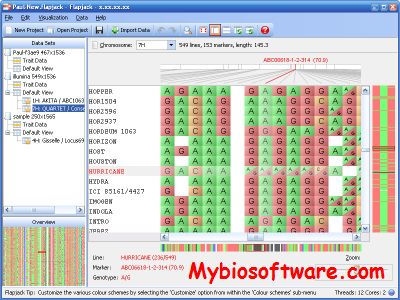
Flapjack is a new software tool for graphical genotyping and haplotype visualization which is required that can routinely handle the large data volumes generated by high throughput SNP and comparable genotyping technologies. Flapjack is a new visualization tool to facilitate analysis of these data types. Its visualizations are rendered in real-time allowing for rapid navigation and comparisons between lines, markers and chromosomes.

::DEVELOPER

Information & Computational Sciences, The James Hutton Institute

:: SCREENSHOTS

:: REQUIREMENTS

  • Windows / Linux / MacOSX
  • Java

:: DOWNLOAD

 Flapjack

:: MORE INFORMATION

Citation

Iain Milne etc.
Flapjack – Graphical Genotype Visualization
Bioinformatics (2010)doi : 10.1093/bioinformatics/btq580

QUANTO 1.2.4 – Computes Sample Size or Power for Association Studies

QUANTO 1.2.4

:: DESCRIPTION

Quanto is a program that computes sample size or power for association studies of genes, environmental factors, gene-environment interaction, or gene-gene interaction. Available study designs for a disease (binary) outcome include the unmatched case-control, matched case-control, case-sibling, case-parent, and case-only designs. Study designs for a quantitative tra it include independent individuals and case parent designs.

::DEVELOPER

The Division of Biostatistics @ usc.edu

:: SCREENSHOTS

:: REQUIREMENTS

  • Windows

:: DOWNLOAD

 QUANTO

:: MORE INFORMATION

Citation

Gauderman (2002),
Sample size requirements for matched case-control studies of gene-environment interaction“,
Statistics in Medicine, 21:35-50.

METASOFT 2.0.1 – Meta-analysis Tool

METASOFT 2.0.1

:: DESCRIPTION

METASOFT is a meta-analysis software tool for genome-wide association studies that provides the following methods

Fixed Effects model (FE): Fixed effects model based on inverse-variance-weighted effect size.
Random Effects model (RE): Conventional random effects model based on inverse-variance-weighted effect size. Heterogeneity is estimated using DerSimonian-Laird method.
Han and Eskin’s Random Effects model (RE2): Random effects model that increases power under heterogeneity.
Binary Effects model (BE): Random effects model assuming that the effects either exist or not in the studies.

::DEVELOPER

ZarLab

:: SCREENSHOTS

N/A

:: REQUIREMENTS

  • Linux / Mac OsX / Windows
  • Java  

:: DOWNLOAD

 METASOFT

:: MORE INFORMATION

Citation

Buhm Han and Eleazar Eskin,
Random-Effects Model Aimed at Discovering Associations in Meta-Analysis of Genome-wide Association Studies”,
The American Journal of Human Genetics (2011) 88, 586-598.

QGAStation 2.0 – Software for the Classical Quantitative Genetics

QGAStation 2.0

:: DESCRIPTION

QGAStation has several features: Handle complicated genetic models for agronomic traits, seed traits, and developmental traits; Analyze unbalanced data; Combine jackknifing techniques to test the significance of each genetic parameter; Some important references are listed in the result files.

::DEVELOPER

ZJU-IBI

:: SCREENSHOTS

:: REQUIREMENTS

  • windows/MacOsX

:: DOWNLOAD

 QGAStation

:: MORE INFORMATION

CFC 1.0 – Monitor Genetic Diversity

CFC 1.0

:: DESCRIPTION

CFC is originally developed to compute population statistics on relationships by a computationally efficient indirect method.

::DEVELOPER

Mehdi Sargolzaei

:: SCREENSHOTS

:: REQUIREMENTS

  • Windows

:: DOWNLOAD

 CFC

:: MORE INFORMATION

Citation

Sargolzaei, M., H. Iwaisaki and J.J. Colleau. 2006.
CFC: A tool for monitoring genetic diversity.
Proc. 8th World Congr. Genet. Appl. Livest. Prod., CD-ROM Communication 27-28. Belo Horizonte, Brazil, Aug. 13-18, 2006.

MargFreq 1.02 – Calculate Marginal Frequencies at each Position of a Nucleotide/Amino Acid Sequence

MargFreq 1.02

:: DESCRIPTION

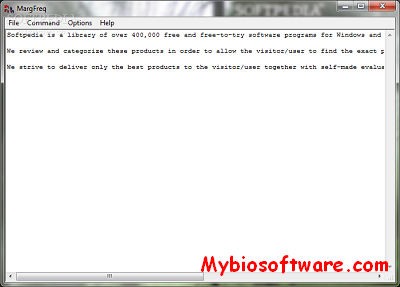
MargFreq is a relatively user-friendly Windows program that does a repetitive task – calculating the marginal frequencies at each position of a nucleotide/amino acid sequence. This program accepts sequence alignments in many different formats. It also does some rudimentary analysis for covariation.

::DEVELOPER

Stuart Ray, M.D.

:: SCREENSHOTS

:: REQUIREMENTS

  • Windows

:: DOWNLOAD

MargFreq

:: MORE INFORMATION

Before you download software you need to read disclaimer.


LSR – Estimate Region-specific p-values in Genetic Association Mapping studies

LSR

:: DESCRIPTION

LSR (Longest Run Test) is an S-plus program computes the distribution and the first moment of the length of the longest k-interrupted run (Lk) in a binary sequence.

::DEVELOPER

Cathy S.J. Fann lab,Institute of Biomedical Informatics, National Yang-Ming University, Taipei

:: SCREENSHOTS

N/A

:: REQUIREMENTS

  • Linux
  • S-plus

:: DOWNLOAD

  LSR

:: MORE INFORMATION

Citation

BMC Bioinformatics. 2008 May 27;9:246. doi: 10.1186/1471-2105-9-246.
Using the longest significance run to estimate region-specific p-values in genetic association mapping studies.
Lian IeB, Lin YH, Lin YC, Yang HC, Chang CJ, Fann CS.

HIERFSTAT 0.5-10 – Package for R to Compute & Test Hierarchical F-statistics

HIERFSTAT 0.5-10

:: DESCRIPTION

HIERFSTAT is a package for R allowing to estimate F-statistics and variance components with the methods of moments for any number of levels in a hierarchy. The package also allows to test the significance of population differentiation using the likelihood ratio G-statistic or the variance components.

::DEVELOPER

Jérôme Goudet.

:: SCREENSHOTS

N/A

:: REQUIREMENTS

:: DOWNLOAD

HIERFSTAT

:: MORE INFORMATION

Citation

Goudet, J. (2005)
Hierfstat, a package for R to compute and test hierarchical F-statistics.
Molecular Ecology Notes. 5: 184-186