CoPlot 6.45 – Software for Great Scientific Graphs, Maps, and Technical Drawings

CoPlot 6.45

:: DESCRIPTION

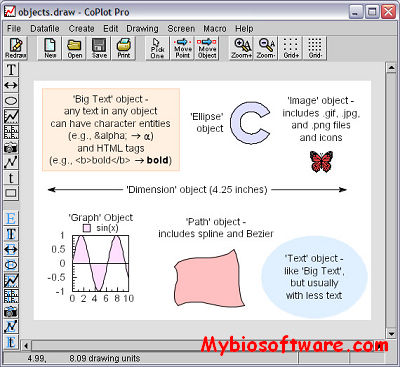
CoPlot is an incredibly versatile program for making publication-quality 2D and 3D scientific graphs (which plot data and equations), maps, and technical drawings. Every aspect of CoPlot has been designed around one basic goal: to make a program that is so versatile that scientists and engineers can easily get exactly what they want. CoPlot includes CoStat for data handling and statistics.

::DEVELOPER

CoHort Software

:: SCREENSHOTS

:: REQUIREMENTS

  • Linux / Mac OsX / Windows
  • Java

:: DOWNLOAD

CoPlot

:: MORE INFORMATION

Order

SLIF 2-2 – Subcellular Location Image Finder

SLIF 2-2

:: DESCRIPTION

SLIF finds fluorescence microscope images in on-line journal articles, and indexes them according to cell line, proteins visualized, and resolution.

::DEVELOPER

Murphy Lab

:: SCREENSHOTS

N/A

:: REQUIREMENTS

  • Linux
  • Matlab
  • Java

:: DOWNLOAD

 SLIF

:: MORE INFORMATION

Citation

Bioinformatics. 2008 Feb 15;24(4):569-76.
Improved recognition of figures containing fluorescence microscope images in online journal articles using graphical models.
Qian Y, Murphy RF.

PatternUnmixer 2.0 – Calculate the Fraction of Probe in each Subcellular Compartment for images containing mixed pattern

PatternUnmixer 2.0

:: DESCRIPTION

PatternUnmixer (formerly called PUnmix) learns a model of fundamental subcellular patterns using user-specified images of “pure” subcellular patterns (e.g., lysosomes, endosomes) and then uses that model to calculate the fraction of probe in each subcellular compartment for images containing mixed patterns.

::DEVELOPER

Murphy Lab

:: SCREENSHOTS

N/A

:: REQUIREMENTS

  • Windows/Linux/MacOsX
  • Matlab

:: DOWNLOAD

 PatternUnmixer

:: MORE INFORMATION

Citation

IEEE Trans Image Process. 2005 Sep;14(9):1351-9.
Object type recognition for automated analysis of protein subcellular location.
Zhao T, Velliste M, Boland MV, Murphy RF.

T. Peng, G.M.C. Bonamy, E. Glory, D. Rines, S. K. Chanda, and R. F. Murphy (2010)
Automated Unmixing Of Subcellular Patterns: Determining the Distribution of Probes Between Different Subcellular Locations.
Proc. Natl. Acad. Sci. U.S.A. 107:2944-2949

OMERO.searcher 1.3 – Content-based Image search for Microscope Images

OMERO.searcher 1.3

:: DESCRIPTION

OMERO.searcher is an open source addon to OMERO to enable content-based image searching.

::DEVELOPER

Murphy Lab

:: SCREENSHOTS

N/A

:: REQUIREMENTS

  • Windows/Linux/MacOsX
  • Python

:: DOWNLOAD

  OMERO.searcher

:: MORE INFORMATION

Citation

Nat Methods. 2012 Jun 28;9(7):633-4. doi: 10.1038/nmeth.2086.
OMERO.searcher: content-based image search for microscope images.
Cho BH, Cao-Berg I, Bakal JA, Murphy RF.

CellSegmenter 1.0 – Set Cell Image Boundaries

CellSegmenter 1.0

:: DESCRIPTION

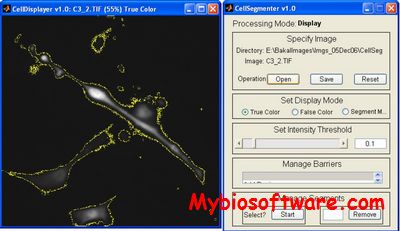
CellSegmenter is a software application which allowed to vary and set intensity thresholds, and select cells using simple point-and-click operations.

::DEVELOPER

John Aach

:: SCREENSHOTS

CellSegmenter

:: REQUIREMENTS

  • Windows/Linux/MacOsX
  • MatLab

:: DOWNLOAD

 CellSegmenter

:: MORE INFORMATION

Citation:

Chris Bakal, John Aach, George M. Church, and Norbert Perrimon (2007)
Quantitative Morphological Signatures Define Local Signaling Networks Regulating Cell Morphology,
Science 316:1753

CalMorph 1.3 – Process Microscopic Images and Generate Quantitative Data about Yeast Cell

CalMorph 1.3

:: DESCRIPTION

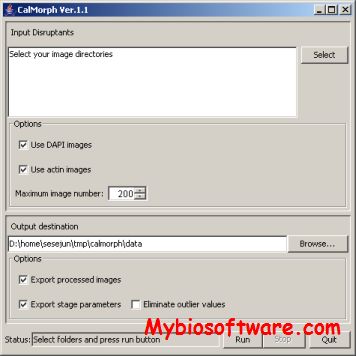
CalMorph is a program that outputs a large amount of data on cell cycle phase, cell forms, etc., for individual cells, from a set of pictures of cell walls, cell nuclei, and actins.

::DEVELOPER

Morishita Laboratory

:: SCREENSHOTS

CalMorph

:: REQUIREMENTS

  • Windows/Linux/MacOsX
  • Java

:: DOWNLOAD

  CalMorph

:: MORE INFORMATION

Citation:

Curr Genet. 2006 Apr;49(4):237-47.
Evaluation of image processing programs for accurate measurement of budding and fission yeast morphology.
Suzuki G, Sawai H, Ohtani M, Nogami S, Sano-Kumagai F, Saka A, Yukawa M, Saito TL, Sese J, Hirata D, Morishita S, Ohya Y.

HypoTrace – Image Analysis Software for Measuring Hypocotyl Growth and Shape

HypoTrace

:: DESCRIPTION

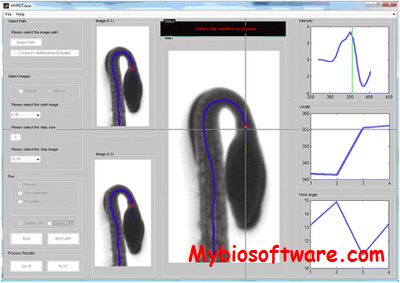
HypoTrace takes time series of image files as input and output growth rate as well as hook angle measurements for Hypocotyls. The software comes with a build-in Graphical User Interface, which allows the software to be run under three modes: 1. Automatic mode with no user intervention, good for high quality images; 2. Semi-Auto mode with a little bit user intervention, good for fair quality images; 3. Manual mode, work for all images including really bad quality images. The three modes are designed to effectively detect the cotyledons bifurcation point under all conditions.

::DEVELOPER

Liya Wang

:: SCREENSHOTS

HypoTrace

:: REQUIREMENTS

  • Windows / Linux / MacOsX
  • Matlab

:: DOWNLOAD

 HypoTrace

:: MORE INFORMATION

Citation

Wang L., Uilecan I. V., Assadi A. H., Kozmik C. A., Spalding E. P.,
HypoTrace: Image Analysis Software for Measuring Hypocotyl Growth and Shape Demonstrated on Arabidopsis Seedlings Undergoing Photomorphogenesis,
Plant Physiol. 2009, 149(4), 1632-1637.

Software tools for analysis of Immunogold Labeling 1.3.4

Software tools for analysis of Immunogold Labeling 1.3.4

:: DESCRIPTION

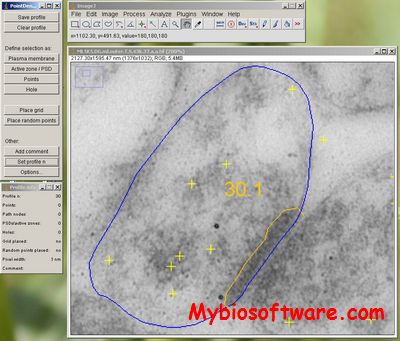
The softwares is a family of analysis tools, for use together with ImageJ, that Max Larsson has written to aid in the analysis of immunogold labeled electron micrographs. The softwares include:

  • PointDensity 1.0pre4 : Use this when you have a single point type (e.g. single immunogold labeling) and closed paths (e.g. nerve terminals). 
  • DistToPath 20100216 . Use this when you have a single point type and simple open paths (e.g. portions of plasma membrane).
  • ParticleDensityDouble 20101215. Use this when you have two point types (e.g. double immunogold labeling) and closed paths (e.g. nerve terminals).
  • Synapse 20100903 . Use this when you have a single point type and open paths with synapse-like structures (e.g. portions of postsynaptic membrane with one or more postsynaptic densities).
  • PointDensitySyn 20131115 Use this when you have a single point type and closed paths with synapse-like structures (e.g., dendritic spines with post-synaptic densities).

::DEVELOPER

Max Larsson

:: SCREENSHOTS

Immunogold

:: REQUIREMENTS

:: DOWNLOAD

 The softwares

:: MORE INFORMATION

Engauge Digitizer 12.2.2 – Convert an Image File into Numbers

Engauge Digitizer 12.2.2

:: DESCRIPTION

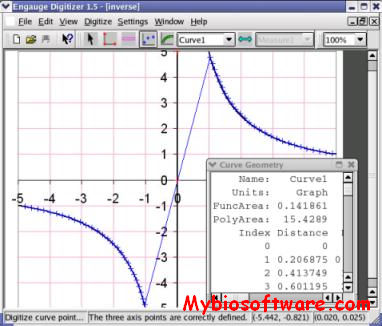
Engauge Digitizer converts an image file showing a graph or map, into numbers. The image file can come from a scanner, digital camera or screenshot. The numbers can be read on the screen, and written or copied to a spreadsheet.

::DEVELOPER

Mark Mitchell

:: SCREENSHOTS

:: REQUIREMENTS

  • Windows / Linux / MacOSX

:: DOWNLOAD

Engauge Digitizer

:: MORE INFORMATION

CI Micro v2.1 – Analyzing Time-lapse Experiments of Cell Migration, Invasion and Wound Healing assays

CI Micro v2.1

:: DESCRIPTION

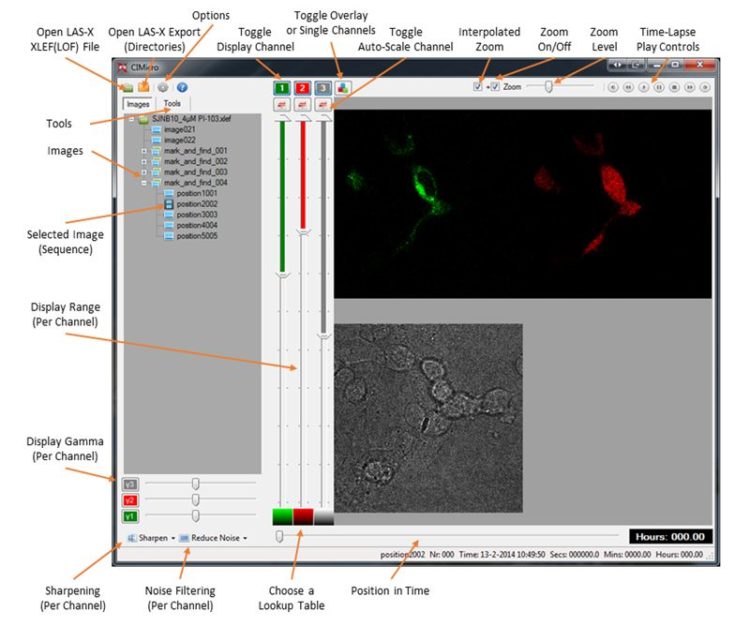
CI Micro was developed primary for quickly analyzing time-lapse experiments of cell migration, invasion and wound healing assays. Time-lapse experiments saved in Leica’s LIF or (auto-saved) XLEF files can be opened with no delay in loading time. Interactive measurements can be done by the area or counting tool and are save together with experimental data. Extra options are Movie Export, 3D features and support for TIFF files.

::DEVELOPER

the Cellular Imaging Core Facility

:: SCREENSHOTS

:: REQUIREMENTS

  • Windows
  •  .NET Framework 4.6.1 or higher

:: DOWNLOAD

CI Micro

:: MORE INFORMATION