ArrayCluster 1.0 – Mixed Factors Analysis of Microarray Gene Expression Data

ArrayCluster 1.0

:: DESCRIPTION

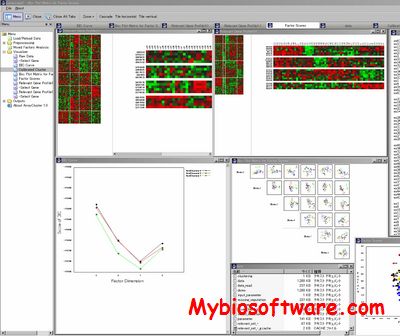
ArrayCluster is one of the significant challenges in gene expression analysis to find unknown subtypes of several diseases at the molecular levels. This task can be addressed by grouping gene expression patterns of the collected samples on the basis of a large number of genes. Application of commonly used clustering methods to such a dataset however are likely to fail due to over-learning, because the number of samples to be grouped is much smaller than the data dimension which is equal to the number of genes involved in the dataset. To overcome such difficulty, we developed a novel model-based clustering method, referred to as the mixed factors analysis.

::DEVELOPER

ArrayCluster Team

:: SCREENSHOTS

:: REQUIREMENTS

  • Windows

:: DOWNLOAD

 ArrayCluster

:: MORE INFORMATION

Citation

Bioinformatics. 2006 Jun 15;22(12):1538-9.
ArrayCluster: an analytic tool for clustering, data visualization and module finder on gene expression profiles.
Yoshida R, Higuchi T, Imoto S, Miyano S.
EGPC / MVGPC 1.0 – Multi-class Classifier for Microarray data

EGPC / MVGPC 1.0

:: DESCRIPTION

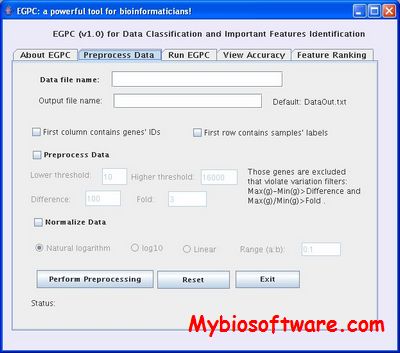
EGPC / MVGPC (majority voting genetic programming classifier)is a multi-class classifier based on genetic programming and majority voting for microarray data.

::DEVELOPER

IBA Laboratory, The University of Tokyo

:: SCREENSHOTS

EGPC

:: REQUIREMENTS

  • Linux /windows/MacOsX
  • Java

:: DOWNLOAD

 EGPC / MVGPC 

:: MORE INFORMATION

Citation

IEEE/ACM Trans Comput Biol Bioinform. 2009 Apr-Jun;6(2):353-67. doi: 10.1109/TCBB.2007.70245.
Prediction of cancer class with majority voting genetic programming classifier using gene expression data.
Paul TK, Iba H.

MAIA 2.75 – Microarray Image Analysis

MAIA 2.75

:: DESCRIPTION

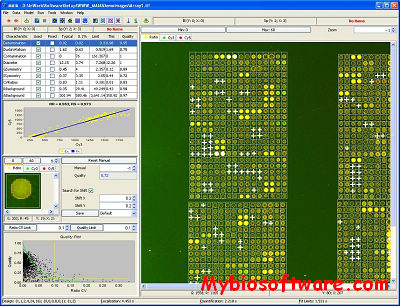
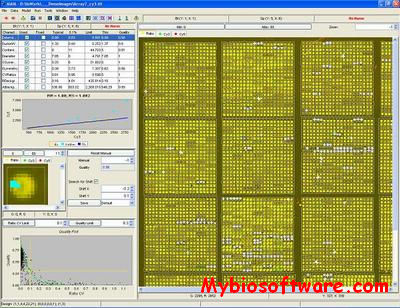
MAIA is a software package for automatic processing of the one- and two- (typically, Cy3-green/Cy5-red) color images produced in cDNA, CGH (comparative genome hybridization) or protein microarray technologies. It incorporates the following modules:

  • The spot localization module
  • The spot quantification module
  • The quality control module
  • The image simulator

::DEVELOPER

Institut Curie

:: SCREENSHOTS

:: REQUIREMENTS

:: DOWNLOAD

MAIA

:: MORE INFORMATION

E-Predict 1.0 – Microarray-based Species Identification

E-Predict 1.0

:: DESCRIPTION

E-Predict compares observed hybridization patterns with theoretical energy profiles representing different species. We demonstrate the application of the algorithm to viral detection in a set of clinical samples and discuss its relevance to other metagenomic applications.

::DEVELOPER

DeRisi LabUCSF

:: SCREENSHOTS

N/A

:: REQUIREMENTS

  • Linux
  • Apache
  • Perl

:: DOWNLOAD

 E-Predict

:: MORE INFORMATION

Citation

Urisman A, Fischer KF, Chiu CY, Kistler AL, Beck S, Wang D, DeRisi JL.
E-Predict: A Computational Strategy for Species Identification Based on Observed DNA Microarray Hybridization Patterns.
Genome Biology 2005, 6:R78


TIPMaP – Transcript Isoform Profiles from Microarray Probes

TIPMaP

:: DESCRIPTION

TIPMaP is a tool developed to identify differentially regulated transcripts (specific to human, mouse and rat).

::DEVELOPER

Institute of Bioinformatics and Applied Biotechnology, Bangalore, India,

:: SCREENSHOTS

N/A

:: REQUIREMENTS

  • Web Browser

:: DOWNLOAD

NO

:: MORE INFORMATION

Citation

Chitturi N, Balagannavar G, Chandrashekar DS, Abinaya S, Srini VS, Acharya KK.
TIPMaP: a web server to establish transcript isoform profiles from reliable microarray probes.
BMC Genomics. 2013 Dec 27;14:922. doi: 10.1186/1471-2164-14-922. PMID: 24373374; PMCID: PMC3884118.

opm 1.1.0 – Analysing Phenotype Microarray and Growth Curve Data

opm 1.1.0

:: DESCRIPTION

opm is an R package designed to analyse multidimensional OmniLog phenotype microarray (PM) data.

::DEVELOPER

Leibniz Institute DSMZ

:: SCREENSHOTS

N/A

:: REQUIREMENTS

  • Windows/Linux/MacOsX
  • R package

:: DOWNLOAD

 opm

 :: MORE INFORMATION

Citation

Bioinformatics. 2013 Jul 15;29(14):1823-4. doi: 10.1093/bioinformatics/btt291. Epub 2013 Jun 5.
opm: an R package for analysing OmniLog(R) phenotype microarray data.
Vaas LA1, Sikorski J, Hofner B, Fiebig A, Buddruhs N, Klenk HP, Goker M.

rsgcc 1.0.6 – Gini methodology-based correlation and Clustering analysis of Microarray and RNA-Seq Gene Expression data

rsgcc 1.0.6

:: DESCRIPTION

rsgcc is an R package that can be utilized as an alternative option for biologists to perform clustering analyses of gene expression patterns or transcriptional network analyses.

::DEVELOPER

Ma Lab

:: SCREENSHOTS

N/A

:: REQUIREMENTS

  • Windows/Linux/MacOsX
  • R package

:: DOWNLOAD

 rsgcc

:: MORE INFORMATION

Citation

Plant Physiol. 2012 Sep;160(1):192-203. doi: 10.1104/pp.112.201962. Epub 2012 Jul 13.
Application of the Gini correlation coefficient to infer regulatory relationships in transcriptome analysis.
Ma C1, Wang X.

QTModel 0.70Beta – Mixed Linear Model Analysis, Microarray Data Analysis and Diallele Cross Analysis

QTModel 0.70Beta

:: DESCRIPTION

QTModel is user-friendly computer software which packaged with modules for microarray data analysis, diallele design analysis and mixed model analysis.The mixed model module is developed for analyzing data from experimental designs with random factors. It is now available for commonly used randomized block design, randomized complete block design, latin square design, factorial design, multi-factor factorial design, nested design, and cross nested design etc. For fixed factors, pair-wised comparisons are done for all possible pairs of fixed effects of one factor. For random factors, some mixed linear model approaches, such as MINQUE, MIVQUE, REML and EM, will be used to estimate the variances of these random factors, and also unbiased prediction methods, such as BLUP, LUP and AUP, are used to predict the random effects of the random factors.

::DEVELOPER

ZJU-IBI

:: SCREENSHOTS

:: REQUIREMENTS

  • Windows

:: DOWNLOAD

 QTModel

:: MORE INFORMATION

Citation

Funct Integr Genomics. 2009 Feb;9(1):59-66. Epub 2008 Sep 5.
Identifying differentially expressed genes in human acute leukemia and mouse brain microarray datasets utilizing QTModel.
Yang J, Zou Y, Zhu J.

chipchipnorm 1.0.1 – Normalize 2-color Microarray Data

chipchipnorm 1.0.1

:: DESCRIPTION

chipchipnorm (ChIP-chip normalization) is a R package that can be incorporated into the normalization workflow for chip-chip data, chromatin immunoprecipitation (ChIP) with microarray technology (chip).

:DEVELOPER

Peter Park’s lab at CBMI, Harvard Medical School

:: SCREENSHOTS

N/A

:: REQUIREMENTS

  • Windows/Linux / MacOsX
  • R package

:: DOWNLOAD

 chipchipnorm

:: MORE INFORMATION

Citation

Shouyong Peng, Artyom A Alekseyenko, Erica Larschan, Mitzi I Kuroda, and Peter J Park.
Normalization and experimental design for ChIP-chip data.
BMC Bioinformatics, 8(219), 2007.

GECS – Glycan Structure Prediction from Microarray data

GECS

:: DESCRIPTION

GECS (Gene Expression to Chemical Structure) is a collection of prediction methods linking genomic or transcriptomic contents of genes to chemical structures of biosynthetic substances. This N-Glycan Prediction Server is based on the repertoire of glycosyltransferases for N-glycan biosynthesis.

::DEVELOPER

Kyoto University Bioinformatics Center

:: SCREENSHOTS

N/A

:: REQUIREMENTS

  • Web Browser

:: DOWNLOAD

  NO

:: MORE INFORMATION

Citation

Genome Inform. 2007;18:237-46.
An improved scoring scheme for predicting glycan structures from gene expression data.
Suga A, Yamanishi Y, Hashimoto K, Goto S, Kanehisa M.