rsgcc 1.0.6 – Gini methodology-based correlation and Clustering analysis of Microarray and RNA-Seq Gene Expression data

rsgcc 1.0.6

:: DESCRIPTION

rsgcc is an R package that can be utilized as an alternative option for biologists to perform clustering analyses of gene expression patterns or transcriptional network analyses.

::DEVELOPER

Ma Lab

:: SCREENSHOTS

N/A

:: REQUIREMENTS

  • Windows/Linux/MacOsX
  • R package

:: DOWNLOAD

 rsgcc

:: MORE INFORMATION

Citation

Plant Physiol. 2012 Sep;160(1):192-203. doi: 10.1104/pp.112.201962. Epub 2012 Jul 13.
Application of the Gini correlation coefficient to infer regulatory relationships in transcriptome analysis.
Ma C1, Wang X.

ClusterProject 1.0 – Computer Software for Clustering Analysis

ClusterProject 1.0

:: DESCRIPTION

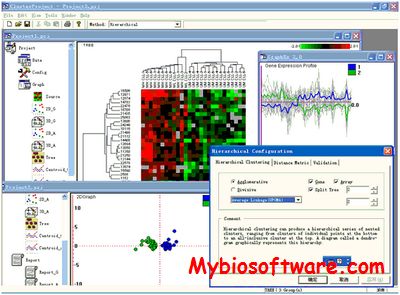
ClusterProject is a program that provides a computational and graphical environment for analyzing data from DNA microarray experiments, or other corresponding cluster datasets. This software with a graphical user interface contains various clustering methods (ten agglomerative hierarchical methods, one divisive hierarchical method and three partitional clustering methods), various similarity metrics, and the evaluation metrics, as well as multi-variant analysis including PCA and the mixed model approach.

::DEVELOPER

ZJU-IBI

:: SCREENSHOTS

:: REQUIREMENTS

  • Windows

:: DOWNLOAD

 ClusterProject

:: MORE INFORMATION

Citation

Genomics Proteomics Bioinformatics. 2005 Feb;3(1):36-41.
Clustering gene expression data based on predicted differential effects of GV interaction.
Pan HY, Zhu J, Han DF.

ACES – Machine Learning Toolbox for Clustering analysis and Visualization

ACES

:: DESCRIPTION

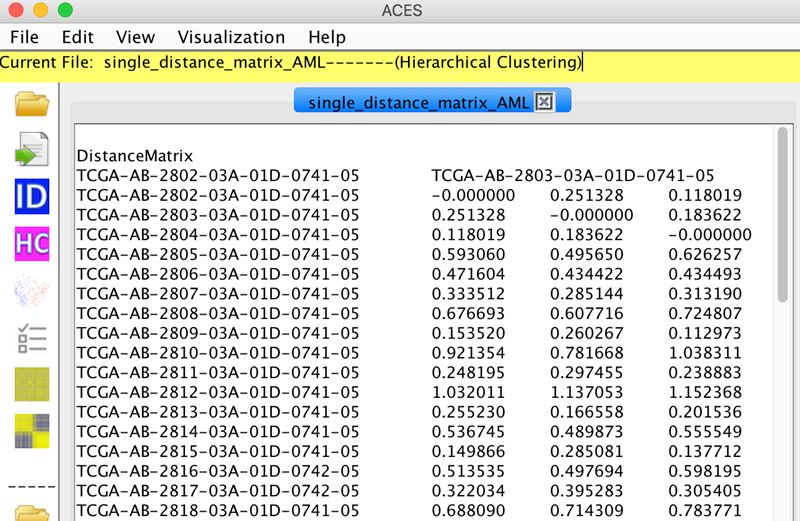
ACES is a machine learning toolbox for clustering analysis and visualization of both biological data and other types data. Given the biological data or their distance/probability matrix, ACES can automatically extract the features of each identity and cluster them by various widely used clustering algorithms.

::DEVELOPER

Grabherr Group

:: SCREENSHOTS

:: REQUIREMENTS

  • Linux / Windows
  • Java

:: DOWNLOAD

ACES

:: MORE INFORMATION

Citation

Gao J, Sundström G, Moghadam BT, Zamani N, Grabherr MG.
ACES: a machine learning toolbox for clustering analysis and visualization.
BMC Genomics. 2018 Dec 27;19(1):964. doi: 10.1186/s12864-018-5300-y. PMID: 30587115; PMCID: PMC6307290.

ClusterViz 1.0.3 – Clustering Analysis of Biological Network

ClusterViz 1.0.3

:: DESCRIPTION

ClusterViz finds clusters (highly interconnected regions, protein complexes or functional module) in a network using various clustering algorithms.

::DEVELOPER

CSU-Bioinformatics Group

:: SCREENSHOTS

N/A

:: REQUIREMENTS

  • Linux / Windows/ MacOsX
  • Java
  • Cytoscape

:: DOWNLOAD

 ClusterViz

:: MORE INFORMATION

Citation

Wang J, Zhong J, Chen G, Li M, Wu FX, and Pan Y.
ClusterViz: a Cytoscape APP for Clustering Analysis of Biological Network,
IEEE/ACM Transactions on Computational Biology and Bioinformatics, 2014, DOI 10.1109/TCBB.2014.2361348.

Medusa 3.0 – Visualization and Clustering Analysis of Biological Network

Medusa 3.0

:: DESCRIPTION

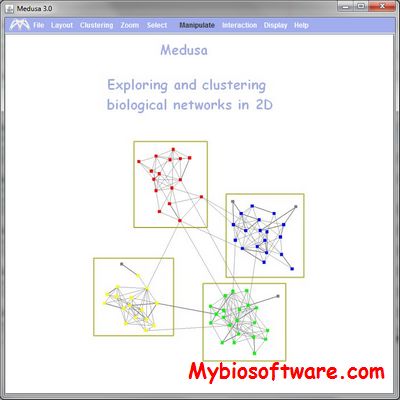
Medusa is a java standalone application for visualization and clustering analysis of biological networks in 2D. It is highly interactive and it supports weighted and multi-edged graphs where each edge between two bioentities can represent a different biological concept. Comparing to previous versions, it is currently enriched with a variety of layout and clustering methods for more intuitive visualizations. It is easy to integrate with web application since it is offered as an applet.

::DEVELOPER

Medusa Team

:: SCREENSHOTS

:: REQUIREMENTS

  • Windows / Linux / Mac OsX
  • Java

:: DOWNLOAD

 Medusa

:: MORE INFORMATION

Citation

Medusa: a simple tool for interaction graph analysis.
Hooper SD, Bork P
Bioinformatics. 2005 Dec 15; 21(24): 4432-3. Epub 2005 Sep 27; PubMed: 16188923.