SCA – Sequence Composition Analysis

SCA

:: DESCRIPTION

The SCA (sequence composition analysis) takes a set of sequences in fasta format and generates a 2-dimensional crossed graph displaying the value of a given formula on the x-axis against the year of the sequences on the y-axis. The year is taken from the header line of each source sequence (starting with “>”). Additionally the points may be colored depending of the host the sequence is taken from.

::DEVELOPER

Institute of Bioinformatics WWU Muenster

:: SCREENSHOTS

N/A

:: REQUIREMENTS

  • Linux / Windows / MacOsX
  • Java

:: DOWNLOAD

 SCA

:: MORE INFORMATION

CMView 1.1.1 – Protein Contact Map Visualization and Analysis

CMView 1.1.1

:: DESCRIPTION

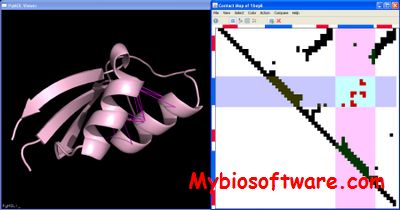
CMView is an intervative contact map visualization and analysis tool. The tool provides functions for contact map calculation from structure, basic editing, visualization in contact map and 3D space and structural comparison with different built-in alignment methods.

::DEVELOPER

CMView team

:: SCREENSHOTS

:: REQUIREMENTS

  • Linux / Windows / MacOsX
  • Java

:: DOWNLOAD

 CMView

:: MORE INFORMATION

Citation

Bioinformatics. 2011 Jun 1;27(11):1573-4. Epub 2011 Apr 5.
CMView: interactive contact map visualization and analysis.
Vehlow C, Stehr H, Winkelmann M, Duarte JM, Petzold L, Dinse J, Lappe M.

SITES 1.1 – Analysis of Comparative DNA Sequence data

SITES 1.1

:: DESCRIPTION

SITES is a computer program for the analysis of comparative DNA sequence data.  Basic analyses include: data summaries by polymorphism class;  polymorphism estimates within and between groups (species); estimates of migration, neutral model, and recombination parameters; and linkage disequilibrium analyses.  SITES is primarily intended for data sets with multiple closely related sequences. It is especially useful when multiple sequences have been obtained from each of one or several closely related populations or species.

::DEVELOPER

the Hey lab

:: SCREENSHOTS

N/A

:: REQUIREMENTS

  • Windows / Linux / MacOsX

:: DOWNLOAD

 SITES

:: MORE INFORMATION

Citation:

Hey, J and J. Wakeley. 1997.
A coalescent estimator of the population recombination rate.
GENETICS 145: 833-846.

MSBE 1.0.5 – Analysis of Gene Expression data using a new bi-clustering method

MSBE 1.0.5

:: DESCRIPTION

MSBE is a tool for the analysis of gene expression data using a new bi-clustering method. It can find constant bi-clusters and additive bi-clusters.

::DEVELOPER

Lusheng Wang

:: SCREENSHOTS

N/A

:: REQUIREMENTS

  • Windows / Linux
  • Java

:: DOWNLOAD

  MSBE

:: MORE INFORMATION

Citation

Computing the maximum similarity bi-clusters of gene expression data.
Liu X, Wang L.
Bioinformatics. 2007 Jan 1;23(1):50-6.

FAMD 1.31 – Dominant Fingerprint Data Handling and Analysis

FAMD 1.31

:: DESCRIPTION

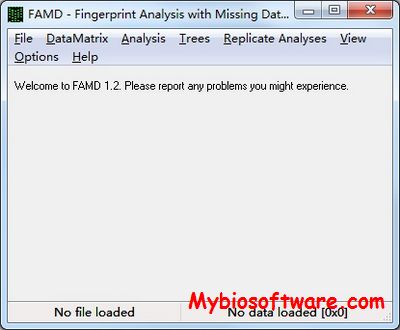
FAMD (Fingerprint Analysis with Missing Data)  is an easy-to-use general-purpose program for dominant fingerprint data handling and analysis (explicitly allowing ambiguities/missing data points) with a graphical user interface, supporting flexible data input and export to a variety of formats. Analysis capabilities include distance-based analysis (trees and PCoA, with graphical 3D viewer), bootstrapping and consensus tree generation, allele frequency estimation, AMOVA, inter-population distances, Shannon’s index.

::DEVELOPER

Dr.  Philipp  Schlüter

:: SCREENSHOTS

:: REQUIREMENTS

  • Windows

:: DOWNLOAD

 FAMD

:: MORE INFORMATION

Citation:

Schlüter, P. M. & Harris, S. A., 2006,
Analysis of multilocus fingerprinting data sets containing missing data.
Mol. Ecol. Notes. 6: 569-572.

VAMP 2.2.8 – Visualisation and Analysis of CGH arrays, transcriptome and other Molecular Profiles

VAMP 2.2.8

:: DESCRIPTION

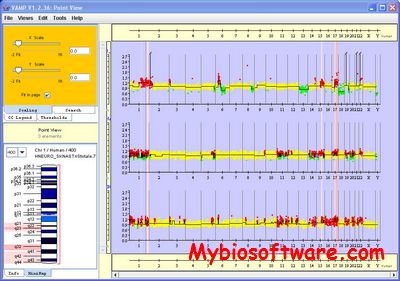
The VAMP software (Visualization and Analysis of array-CGH, transcriptome and other Molecular Profiles)allows the visual comparison of the array-CGH profiles of a cohort of patients, or the confrontation of array-CGH, expression and loss of heterozygosity profiles. VAMP offers many functionalities such as computing recurrent alterations, clustering profiles, crossing with clinical or biological annotations, performing syntenic projection onto the genome of another species.

::DEVELOPER

Bioinformatics Laboratory of Institut Curie (Paris).

:: SCREENSHOTS

:: REQUIREMENTS

  • Windows / Linux / Mac OsX
  • Java

:: DOWNLOAD

 VAMP

:: MORE INFORMATION

Citation:

Philippe La Rosa et al.
VAMP: Visualization and analysis of array-CGH, transcriptome and other molecular profiles
Bioinformatics 2006 22: 2066-2073;

Gene Construction Kit 4.5 – Plasmid Mapping, DNA Cloning Analysis, Vector Manipulation

Gene Construction Kit 4.5

:: DESCRIPTION

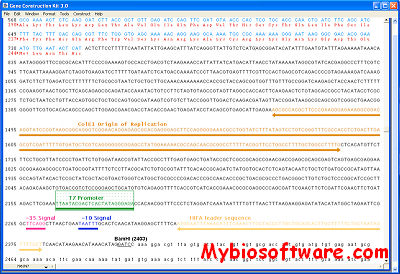
The Gene Construction Kit®(GCK) program has been the preferred plasmid mapping software of leading researchers for more than 20 years. GCK allows easy manipulation of DNA sequences, either graphically or as sequence text – quickly saving users both time and money. GCK eliminates tedious examination of DNA sequence data by automatically identifying open reading frames (ORF’s), keeping track of sticky ends during cutting and pasting of restriction enzyme digestion fragments, assisting with PCR primer design, and enabling comprehensive annotation of DNA sequence features. This DNA analysis software allows multiple files to be opened and displayed simultaneously, allowing DNA sequences to easily be copied and pasted between plasmids and vectors to represent real-world DNA cloning protocols. The Gene Construction Kit software is available for both Windows and Macintosh users, and files can be shared across platforms allowing for easy collaboration.

::DEVELOPER

Textco BioSoftware, Inc.

:: SCREENSHOTS

:: REQUIREMENTS

  • Windows / MacOsX

:: DOWNLOAD

Gene Construction Kit Demo

:: MORE INFORMATION

Proteios 2.19.0 – Multi-user Platform for Analysis and Management of Proteomics data

Proteios 2.19.0

:: DESCRIPTION

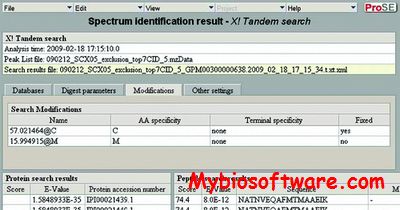
Proteios SE (or ProSE) is meant to be installed on a local server in a proteomics laboratory.

::DEVELOPER

Jari Häkkinen @ Lund University

:: SCREENSHOTS

Proteios

:: REQUIREMENTS

:: DOWNLOAD

  Proteios

:: MORE INFORMATION

Citation

J Proteome Res. 2009 Jun;8(6):3037-43. doi: 10.1021/pr900189c.
The proteios software environment: an extensible multiuser platform for management and analysis of proteomics data.
Häkkinen J, Vincic G, Månsson O, Wårell K, Levander F.

MEGA 11 – Molecular Evolutionary Genetics Analysis

MEGA 11

:: DESCRIPTION

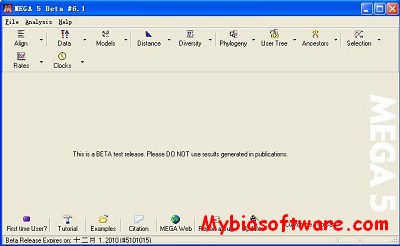
MEGA (Molecular Evolutionary Genetics Analysis)is an integrated tool for automatic and manual sequence alignment, inferring phylogenetic trees, mining web-based databases, estimating rates of molecular evolution, and testing evolutionary hypotheses.

::DEVELOPER

MEGA Team

:: SCREENSHOTS

:: REQUIREMENTS

  • Windows / Linux / MacOSX

:: DOWNLOAD

MEGA

:: MORE INFORMATION

Citation

Mol Biol Evol. 2013 Dec;30(12):2725-9. doi: 10.1093/molbev/mst197. Epub 2013 Oct 16.
MEGA6: Molecular Evolutionary Genetics Analysis version 6.0.
Tamura K, Stecher G, Peterson D, Filipski A, Kumar S.

Tamura K, Peterson D, Peterson N, Stecher G, Nei M, and Kumar S (2011)
MEGA5: Molecular Evolutionary Genetics Analysis using Maximum Likelihood, Evolutionary Distance, and Maximum Parsimony Methods.
Molecular Biology and Evolution (2011)doi: 10.1093/molbev/msr121 First published online: May 4, 2011