ArrayCluster 1.0 – Mixed Factors Analysis of Microarray Gene Expression Data

ArrayCluster 1.0

:: DESCRIPTION

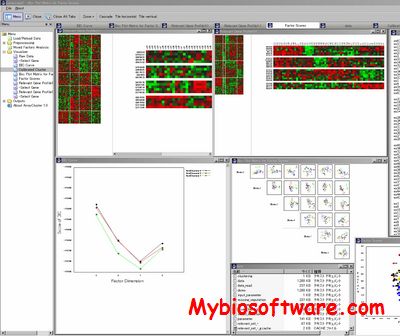
ArrayCluster is one of the significant challenges in gene expression analysis to find unknown subtypes of several diseases at the molecular levels. This task can be addressed by grouping gene expression patterns of the collected samples on the basis of a large number of genes. Application of commonly used clustering methods to such a dataset however are likely to fail due to over-learning, because the number of samples to be grouped is much smaller than the data dimension which is equal to the number of genes involved in the dataset. To overcome such difficulty, we developed a novel model-based clustering method, referred to as the mixed factors analysis.

::DEVELOPER

ArrayCluster Team

:: SCREENSHOTS

:: REQUIREMENTS

  • Windows

:: DOWNLOAD

 ArrayCluster

:: MORE INFORMATION

Citation

Bioinformatics. 2006 Jun 15;22(12):1538-9.
ArrayCluster: an analytic tool for clustering, data visualization and module finder on gene expression profiles.
Yoshida R, Higuchi T, Imoto S, Miyano S.
lemon-tree 3.1.1 – Biological Module Network Inference

lemon-tree 3.1.1

:: DESCRIPTION

LemonTree (former LeMoNe) is an algorithm to infer a module network from biological data. It can integrate heterogeneous data types such as expression data, copy number, microRNA, epigenetic profiles.

::DEVELOPER

Eric Bonnet

:: SCREENSHOTS

N/A

:: REQUIREMENTS

  • Linux/windows/MacOsX
  • Java

:: DOWNLOAD

 lemon-tree

:: MORE INFORMATION

Citation:

Integrative multi-omics module network inference with Lemon-Tree.
Bonnet E, Calzone L, Michoel T.
PLoS Comput Biol. 2015 Feb 13;11(2):e1003983. doi: 10.1371/journal.pcbi.1003983.

Transcription regulatory networks in Caenorhabditis elegans inferred through reverse-engineering of gene expression profiles constitute biological hypotheses for metazoan development.
Vermeirssen V, Joshi A, Michoel T, Bonnet E, Casneuf T, Van de Peer Y.
Mol Biosyst. 2009 Dec;5(12):1817-30. Epub 2009 Jul 17.

TreeBuilder3D 1.0 – Interactive Viewer for Gene Expression Data

TreeBuilder3D 1.0

:: DESCRIPTION

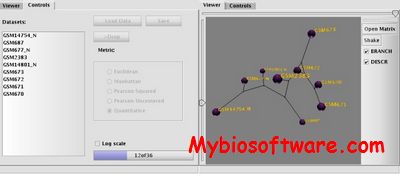
TreeBuilder3D is an interactive viewer that allows organization of SAGE and other types of gene expression data such as microarrays into hierarchical dendrograms, or phenetic networks (the term ‘phenetic’ used as the analysis relies on principals, used in phylogenetic analysis by system biology). Might be used as a visual aid when analyzing differences in expression profiles of SAGE libraries, serves as an alternative to Venn diagrams.

::DEVELOPER

Canada’s Michael Smith Genome Sciences Centre

:: SCREENSHOTS

:: REQUIREMENTS

:: DOWNLOAD

 TreeBuilder3D

:: MORE INFORMATION

Citation

Ruzanov P, Jones SJ.
An interactive tool for visualization of relationships between gene expression profiles.
BMC Bioinformatics. 2006 Apr 6;7:193.

Excavator 2.0 – Gene Expression Data Clustering

Excavator 2.0

:: DESCRIPTION

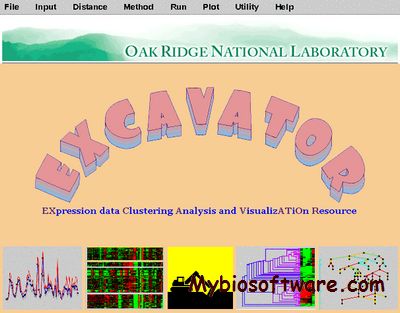
Excavator (EXpression data Clustering Analysis and VisualizATiOn Resource) is a computer software program for gene expression data clustering. It uses a set of unique clustering algorithms developed by the Computational Systems Biology Lab (CSBL) at the University of Georgia. Excavator represents data internally as a minimum spanning tree and outputs results to the user through the use of a micro-array data window, graphs, and a dendrogram viewer.

::DEVELOPER

The Computational Systems Biology Lab

:: SCREENSHOTS

:: REQUIREMENTS

  • Linux/Windows/MacOsX
  • Java

:: DOWNLOAD

 Excavator

:: MORE INFORMATION

Citation

Dong Xu, Victor Olman, Li Wang and Ying Xu
Excavator: a computer program for efficiently mining gene expression data
Nucl. Acids Res. (2003) 31 (19): 5582-5589.

DLMM 0.0.2 – Double-layered Mixture Model for Joint Analysis of Copy Number and Gene Expression Data

DLMM 0.0.2

:: DESCRIPTION

DLMM (Double-layered Mixture Model) is a software to select copy number-associated gene expression changes in high-throughput genomics data. Copy number segmentation results and criterion-based gene selection are separately reported.

::DEVELOPER

Hyungwon Choi

:: SCREENSHOTS

N/A

:: REQUIREMENTS

  • Linux / MacOsX
  • C Compiler

:: DOWNLOAD

  DLMM

:: MORE INFORMATION

Citation:

H. Choi, Z.S. Qin, and D. Ghosh (2010),
A Double-layered Mixture Model for Joint Analysis of Copy Number and Gene Expression Data.
J. Comput. Biol. 17(2):1-17.

topGO 0.97 – Calculat Significance of Biological Terms from Gene Expression Data

topGO 0.97

:: DESCRIPTION

topGO (topology-based Gene Ontology scoring) is a software package for calculating the significance of biological terms from gene expression data. It implements various standard and advanced new algorithms for determining the relevance of Gene Ontology groups from microarrays. A specific feature of the advanced algorithms is the exploitation of the hierarchical graph structure of the GO annotation for coping with the large number of GO groups. Often, related biological terms are scored with a similar statistical significance. Dependencies between GO terms can be de-correlated by accounting for the neighborhood of a GO node when calculating its significance. The new algorithms better detect significant GO terms from gene expression data.

::DEVELOPER

Adrian Alexa  , Max-Planck-Institut Informatik

:: SCREENSHOTS

N/A

:: REQUIREMENTS

:: DOWNLOAD

 topGO

:: MORE INFORMATION

Citation:

Alexa, A.; Rahnenführer, J.; Lengauer, T.,
Improved scoring of functional groups from gene expression data by decorrelating GO graph structure.
Bioinformatics 2006, 22 (13), 1600-7.

Caryoscope 0.4.0 – View Gene Expression Data in Genome

Caryoscope 0.4.0

:: DESCRIPTION

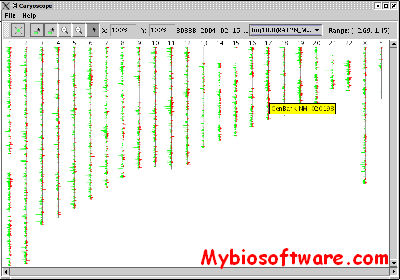
Caryoscope is  an application  for viewing gene expression data in a whole-genome context. Caryoscope has been used to “draw” microarray data onto a set of chromosomes so that changes in DNA copy number can identify regions of chromosome loss or duplication within the genome of tumor cells (Nat Genet. 1999 Sep;23(1):41-6). In addition, microarray data measuring mRNA expression levels can also be visualized in a genomic context using Caryoscope (PNAS 2002 Dec 10;99(25):16144-9). Data viewed with Caryscope need not be limited to microarray data — any type of numerical data that can be represented as a function of genomic position can be visualized using Caryoscope.

::DEVELOPER

Ihab A.B. Awad, Gavin Sherlock etc.

:: SCREENSHOTS

:: REQUIREMENTS

  • Linux / Windows / Max OS X
  • JAVA

:: DOWNLOAD

Caryoscope

:: MORE INFORMATION

Citation:

.Awad, I.A.B, Rees, C.A., Hernandez-Boussard, T., Ball, C.A. and Sherlock, G. (2004)
Caryoscope: An Open Source Java Application for Viewing Microarray Data in a Genomic Context.
BMC Bioinformatics 5:151.

ORIOGEN 4.01 – Analyzes Gene Expression data obtained from Time-course/Dose-response studies

ORIOGEN 4.01

:: DESCRIPTION

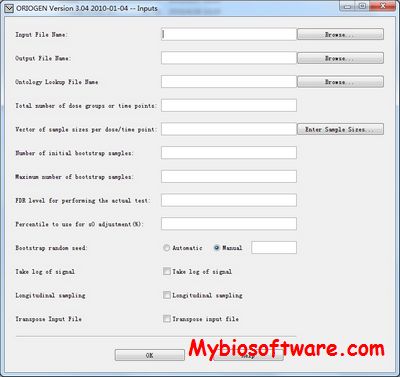
ORIOGEN (Order Restricted Inference for Ordered Gene Expression) analyzes gene expression data obtained from time-course/dose-response studies.

::DEVELOPER

ShareShyamal D. Peddada, Ph.D.

:: SCREENSHOTS

:: REQUIREMENTS

  • Linux / Windows /MacOsX
  • Java 

:: DOWNLOAD

 ORIOGEN

:: MORE INFORMATION

Citation:

Bioinformation. 2007 Apr 10;1(10):414-9.
Order-restricted inference for ordered gene expression (ORIOGEN) data under heteroscedastic variances.
Simmons SJ, Peddada SD.

ExpressionView 1.00 – Explore Biclusters Identified in Gene Expression data

ExpressionView 1.00

:: DESCRIPTION

ExpressionView is an R package that provides an interactive environment to explore biclusters identified in gene expression data. A sophisticated ordering algorithm is used to present the biclusters in a visually appealing layout. From this overview, the user can select individual biclusters and access all the biologically relevant data associated with it. The package is aimed to facilitate the collaboration between bioinformaticians and life scientists who are not familiar with the R language.

::DEVELOPER

Computational Biology Group ,Department of Medical Genetics, University of Lausanne

:: SCREENSHOTS

:: REQUIREMENTS

:: DOWNLOAD

 ExpressionView

:: MORE INFORMATION

Citation

ExpressionView–an interactive viewer for modules identified in gene expression data.
Lüscher A, Csárdi G, de Lachapelle AM, Kutalik Z, Peter B, Bergmann S.
Bioinformatics. 2010 Aug 15;26(16):2062-3. Epub 2010 Jul 29.

BATEx 0.1.2 – A Data Warehouse for Array-based Gene Expression Data of Plants

BATEx 0.1.2

:: DESCRIPTION

The aim of BATEx is the establishment of a data warehouse for array-based gene expression data of plants to enable experiment-spanning expression data analyses. Therefore, data is integrated from various data sources, such as BarleyBase, AtGenExpress, AFGC, TIGR SGED and IPK’s operational system FLAREX.

::DEVELOPER

the Plant Genome Resources Center (PGRC)

:: SCREENSHOTS

N/A

:: REQUIREMENTS

:: DOWNLOAD

  BATEx

:: MORE INFORMATION