SimPlot 3.5.1 – Sequence Similarity Plotting

SimPlot 3.5.1

:: DESCRIPTION

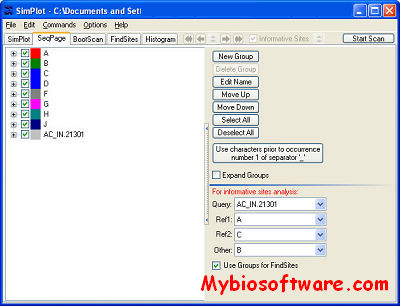
SimPlot (Similarity Plotting) (as well as bootscanning, quick tree generation, and informative-sites analysis) is a popular tool for recombination analysis.

::DEVELOPER

Stuart Ray, M.D.

:: SCREENSHOTS

:: REQUIREMENTS

  • Windows

:: DOWNLOAD

SimPlot if you cannot make that work, please email me for a download link

:: MORE INFORMATION

Reference to the paper in which author first described SimPlot

Lole KS, Bollinger RC, Paranjape RS, Gadkari D, Kulkarni SS, Novak NG, Ingersoll R, Sheppard HW, Ray SC.
Full-length human immunodeficiency virus type 1 genomes from subtype C-infected seroconverters in India, with evidence of intersubtype recombination.
J Virol. 1999 Jan;73(1):152-60.
VarPlot 1.2 – Similarity Plotting for Alignment of Sequences

VarPlot 1.2

:: DESCRIPTION

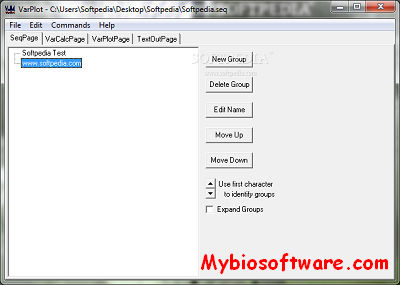
VarPlot is a program that accepts an alignment of sequences, and interactively plots sliding-window analyses of genetic distance among sequences or groups of sequences. It is different from SimPlot because in SimPlot, all groups are compared to one query, whereas in VarPlot all groups are compared to one another. Also, VarPlot includes calculation of nonsynonymous and synonymous distance (using the Nei and Gojobori method at present).

::DEVELOPER

Stuart Ray, M.D.

:: SCREENSHOTS

:: REQUIREMENTS

  • Windows

:: DOWNLOAD

VarPlot

:: MORE INFORMATION

Before you download software you need to read disclaimer.


snp.plotter 0.5.1 – SNP/haplotype Association and Linkage Disequilibrium plotting package

snp.plotter 0.5.1

:: DESCRIPTION

snp.plotter is an R package that creates publishable-quality plots of p-values using single SNP and/or haplotype data. Main features of the package include options to display a linkage disequilibrium (LD) plot and the ability to plot multiple sets of results simultaneously. Plots can be created using global and/or individual haplotype p-values along with single SNP p-values.

::DEVELOPER

Augustin Luna, Kristin Nicodemus (email: augustin@mail.nih.gov)

:: SCREENSHOTS

N/A

:: REQUIREMENTS

:: DOWNLOAD

 snp.plotter

:: MORE INFORMATION

Citation

Luna, Nicodemus (2007),
snp.plotter: an R-based SNP/haplotype association and linkage disequilibrium plotting package“,
Bioinformatics, 23(6):774-776.

visPIG 1.1 – Visual Plotting Interface for Genetics

visPIG 1.1

:: DESCRIPTION

visPIG is a web application to produce multi-track, multi-scale, multi-region plots of genetic data.

::DEVELOPER

Marc Henrion

:: SCREENSHOTS

N/A

:: REQUIREMENTS

  • Windows/ MacOsX/Linux
  • R

:: DOWNLOAD

  visPIG

:: MORE INFORMATION

Citation:

visPIG–a web tool for producing multi-region, multi-track, multi-scale plots of genetic data.
Scales M, Jäger R, Migliorini G, Houlston RS, Henrion MY.
PLoS One. 2014 Sep 10;9(9):e107497. doi: 10.1371/journal.pone.0107497. eCollection 2014.

MetaOmGraph 1.8.1 – Plotting and Analyzing large sets of Biological data

MetaOmGraph 1.8.1

:: DESCRIPTION

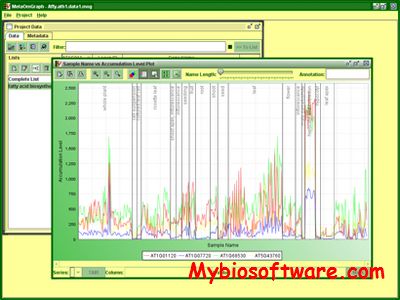
MetaOmGraph is a tool for plotting and analyzing large sets of data while using as little memory as possible. It was designed with biological experiment data in mind.

::DEVELOPER

Wurtele Lab

:: SCREENSHOTS

:: REQUIREMENTS

  • Linux / Windows / MacOsX
  • Java

:: DOWNLOAD

 MetaOmGraph

:: MORE INFORMATION

Citation:

Chem Biodivers. 2012 May;9(5):868-87. doi: 10.1002/cbdv.201100355.
Massive human co-expression network and its medical applications.
Feng Y, Hurst J, Almeida-De-Macedo M, Chen X, Li L, Ransom N, Wurtele ES.

plotIBD 20111108 – Plotting Sampled Inheritance Vectors in Pedigrees

plotIBD 20111108

:: DESCRIPTION

plotIBD is a perl script to assist with plotting sampled inheritance vectors in pedigrees

::DEVELOPER

Ellen M. Wijsman

:: SCREENSHOTS

N/A

:: REQUIREMENTS

  • Linux
  • Perl

:: DOWNLOAD

 plotIBD

:: MORE INFORMATION

Citation:

Hum Hered. 2011;72(4):289-97. doi: 10.1159/000334083. Epub 2011 Dec 23.
Estimation and visualization of identity-by-descent within pedigrees simplifies interpretation of complex trait analysis.
Marchani EE1, Wijsman EM.

trackViewer 1.26.2 – Minimalist design for Plotting Elegant Track Layers

trackViewer 1.26.2

:: DESCRIPTION

trackViewer is a R/Bioconductor package with web interface for drawing elegant interactive tracks or lollipop plot to facilitate integrated analysis of multi-omics data.

::DEVELOPER

Program in Gene Function and Expression@umassmed

:: SCREENSHOTS

N/A

:: REQUIREMENTS

  • Windows/Linux/MacOsX
  • BioConductor
  • R package

:: DOWNLOAD

trackViewer

:: MORE INFORMATION

Citation:

Ou J, Zhu LJ.
trackViewer: a Bioconductor package for interactive and integrative visualization of multi-omics data.
Nat Methods. 2019 Jun;16(6):453-454. doi: 10.1038/s41592-019-0430-y. PMID: 31133757.

rMAPS 2.0.0 – RNA Map analysis and Plotting server for alternative Exon Regulation

rMAPS 2.0.0

:: DESCRIPTION

rMAPS (rna Map Analysis and Plotting Server) is a web server that systematically generates RNA-maps for the analysis of RNA-binding proteins (RBPs) binding sites which have position-dependent functions.

::DEVELOPER

rMAPS team

:: SCREENSHOTS

N/A

:: REQUIREMENTS

  • Web browser

:: DOWNLOAD

 NO

:: MORE INFORMATION

Citation

rMAPS: RNA map analysis and plotting server for alternative exon regulation.
Park JW, Jung S, Rouchka EC, Tseng YT, Xing Y.
Nucleic Acids Res. 2016 May 12. pii: gkw410.