hclust 1.0 – Clustering Expression data with Hopfield Networks

hclust 1.0

:: DESCRIPTION

hclust demonstrates the usage of Hopfield networks for clustering, feature selection and network inference.

::DEVELOPER

hclust team

:: SCREENSHOTS

N/A

:: REQUIREMENTS

  • Windows/Linux/MacOsX
  • Python
  • matplotlib

:: DOWNLOAD

 hclust

:: MORE INFORMATION

Citation

Bioinformatics. 2014 May 1;30(9):1273-9. doi: 10.1093/bioinformatics/btt773. Epub 2014 Jan 8.
Characterizing cancer subtypes as attractors of Hopfield networks.
Maetschke SR1, Ragan MA.

GeneSelector 1.0 – Find Small subset of Genes for Classification of Expression data

GeneSelector 1.0

:: DESCRIPTION

GeneSelector finds a small subset of genes for classification of expression data.

::DEVELOPER

Ari Frank. @Laboratory of Computational Biology , Technion

:: SCREENSHOTS

N/A

:: REQUIREMENTS

  • Windows

:: DOWNLOAD

 GeneSelector

:: MORE INFORMATION

RepeatedHighDim 2.0.0 – Global tests for Expression data of high-dimensional sets of Molecular Features

RepeatedHighDim 2.0.0

:: DESCRIPTION

RepeatedHighDim is an r package of global tests for expression data of high-dimensional sets of molecular features.

::DEVELOPER

Klaus Jung <Klaus.Jung at ams.med.uni-goettingen.de>

:: SCREENSHOTS

N/A

:: REQUIREMENTS

  • Windows/Linux/MacOsX
  • R

:: DOWNLOAD

 RepeatedHighDim

:: MORE INFORMATION

Citation

Adaption of the global test idea to proteomics data with missing values.
Jung K, Dihazi H, Bibi A, Dihazi GH, Beißbarth T.
Bioinformatics. 2014 May 15;30(10):1424-30. doi: 10.1093/bioinformatics/btu062.

Sylamer 1.0 – Fast Assessment of microRNA Binding and siRNA off-target effects from Expression data

Sylamer 1.0

:: DESCRIPTION

Sylamer is a system for finding significantly over or under-represented words in sequences according to a sorted gene list. Typically it is used to find significant enrichment or depletion of microRNA or siRNA seed sequences from microarray expression data. Sylamer is extremely fast and can be applied to genome-wide datasets with ease. Results are plotted in terms of a significance landscape plot. These plots show significance profiles for each word studied across the sorted genelist.

::DEVELOPER

Stijn van Dongen

:: SCREENSHOTS

:: REQUIREMENTS

  • Windows / MacOsX /  Linux
  • Java / R package / C Compiler

:: DOWNLOAD

 Sylamer

:: MORE INFORMATION

Citation

Stijn van Dongen, Cei Abreu-Goodger & Anton J. Enright;
Detecting microRNA binding and siRNA off-target effects from expression data
Nat Methods. 2008 December; 5(12): 1023–1025.

GENIE3 – Inference of Gene Regulatory Networks from Expression data

GENIE3

:: DESCRIPTION

GENIE3 is an algorithm for the inference of gene regulatory networks from expression data. It decomposes the prediction of a regulatory network between p genes into p different regression problems. In each of the regression problems, the expression pattern of one of the genes (target gene) is predicted from the expression patterns of all the other genes (input genes), using tree-based ensemble methods Random Forests or Extra-Trees. The importance of an input gene in the prediction of the target gene expression pattern is taken as an indication of a putative regulatory link.

dynGENIE3 : Extension of GENIE3 for time series data

::DEVELOPER

vân anh huynh-thu

:: SCREENSHOTS

N/A

:: REQUIREMENTS

  • Linux / Windows / MacOsX
  • MatLab / R Package

:: DOWNLOAD

 GENIE3 / dynGENIE3

:: MORE INFORMATION

Citation

Huynh-Thu VA, Geurts P.
dynGENIE3: dynamical GENIE3 for the inference of gene networks from time series expression data.
Sci Rep. 2018 Feb 21;8(1):3384. doi: 10.1038/s41598-018-21715-0. PMID: 29467401; PMCID: PMC5821733.

Inferring regulatory networks from expression data using tree-based methods
Huynh-Thu, V. A., Irrthum, A., Wehenkel, L., and Geurts, P.
PLoS ONE, 5(9):e12776, 2010.

Mask / maskBAD 1.36.0 – Mask bad Probes in Affymetrix Expression data

Mask / maskBAD 1.36.0

:: DESCRIPTION

Mask is an R package and contains several functions to handle Affymetrix expression data. Its goal is to mask BAD probes that bias the expression results.

::DEVELOPER

Michael Dannemann, Michael Lachmann @Department of Genetics/Bioinformatics – Max Planck Institut

:: SCREENSHOTS

N/A

:: REQUIREMENTS

:: DOWNLOAD

 Mask

:: MORE INFORMATION

Citation

BMC Bioinformatics. 2012 Apr 16;13:56. doi: 10.1186/1471-2105-13-56.
‘maskBAD’–a package to detect and remove Affymetrix probes with binding affinity differences.
Dannemann M, Lachmann M, Lorenc A.

SpeCond 1.46.0 – Detect Condition-specific Gene Expression

SpeCond 1.46.0

:: DESCRIPTION

SpeCond performs a gene expression data analysis to detect condition-specific genes. Such genes are significantly up- or down-regulated in a small number of conditions.

::DEVELOPER

Florence Cavalli <florence at ebi.ac.uk>

:: SCREENSHOTS

N/A

::REQUIREMENTS

  • Linux/Windows/MacOsX
  • R
  • Bioconductor

:: DOWNLOAD

 SpeCond

:: MORE INFORMATION

Citation

Genome Biol. 2011 Oct 18;12(10):R101. doi: 10.1186/gb-2011-12-10-r101.
SpeCond: a method to detect condition-specific gene expression.
Cavalli FM1, Bourgon R, Vaquerizas JM, Luscombe NM.

CNAmet 1.2.1 – Integrate Copy Number, Methylation and Expression data

CNAmet 1.2.1

:: DESCRIPTION

CNAmet is an algorithm and R package that facilitates the integration of copy number, methylation and expression data. In addition to the CNAmet algorithm, the R package includes the S2N algorithm for the integration of copy number to expression data.

::DEVELOPER

Hautaniemi Lab

:: SCREENSHOTS

N/A

:: REQUIREMENTS

  • Windows/Linux/MacOsX
  • R Package

:: DOWNLOAD

 CNAmet

:: MORE INFORMATION

Citation

CNAmet: an R package for integrating copy number, methylation and expression data
Riku Louhimo and Sampsa Hautaniemi
Bioinformatics (2011) 27 (6): 887-888.

MATISSE 1.1 – Detection of Functional Modules using Interaction Networks and Expression data

MATISSE 1.1

:: DESCRIPTION

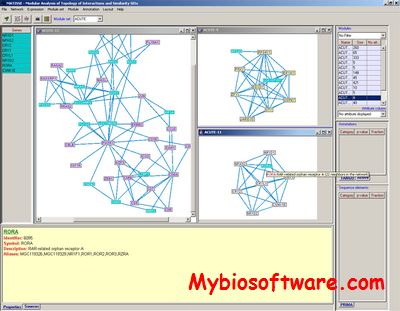
MATISSE (Module Analysis via Topology of Interactions and Similarity SEts) is a program for detection of functional modules using interaction networks and expression data. A functioncal module is a group of cellular components and their interactions that can be attributed a specific biological function.

::DEVELOPER

Ron Shamir’s lab

:: SCREENSHOTS

::REQUIREMENTS

  • Windows/Linux
  • Java

:: DOWNLOAD

 MATISSE

:: MORE INFORMATION

Citation

Identification of functional modules using network topology and high-throughput data
I. Ulitsky and R. Shamir
BMC Systems Biology, Vol. 1, No. 8 (2007)

TileShuffle 0.2.0 – Statistical Analysis of Tiling Array Expression Data

TileShuffle 0.2.0

:: DESCRIPTION

TileShuffle is a software of detection of transcribed or differentially expressed segments in tiling array data by permutation testing.This package contains functions for the analysis of tiling array data. It implements a statistical approach to detect expression or differential expression in terms of differences from the background distribution that avoids any intensity-related parameters. Moreover, it reduces the most dominant tiling array biases using an affinity-dependent permutation in conjunction with a windowing approach.

::DEVELOPER

Kristin Reiche

:: SCREENSHOTS

N/A

:: REQUIREMENTS

:: DOWNLOAD

 TileShuffle

:: MORE INFORMATION