pGQL – Analyzing Gene Expression Time Courses

pGQL

:: DESCRIPTION

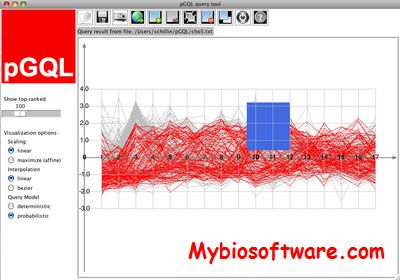
pGQL (probabilistic Graphical Query Language) is a software tool in particular for analyzing gene expression time courses. It allows its user to interactively define linear HMM queries on time course data using rectangular graphical widgets called probabilistic time boxes. The analysis is fully interactive and the graphical display shows the time courses along with the graphical query. The results can be submitted to gPROF directly from pGQL.

::DEVELOPER

Schliep lab

:: SCREENSHOTS

pGQL

:: REQUIREMENTS

  • Linux/ MacOsX/ Windows
  • Python

:: DOWNLOAD

  pGQL

:: MORE INFORMATION

Citation

BioData Min. 2011 Apr 18;4:9. doi: 10.1186/1756-0381-4-9.
pGQL: A probabilistic graphical query language for gene expression time courses.
Schilling R, Costa IG, Schliep A.

ORIOGEN 4.01 – Analyzes Gene Expression data obtained from Time-course/Dose-response studies

ORIOGEN 4.01

:: DESCRIPTION

ORIOGEN (Order Restricted Inference for Ordered Gene Expression) analyzes gene expression data obtained from time-course/dose-response studies.

::DEVELOPER

ShareShyamal D. Peddada, Ph.D.

:: SCREENSHOTS

:: REQUIREMENTS

  • Linux / Windows /MacOsX
  • Java 

:: DOWNLOAD

 ORIOGEN

:: MORE INFORMATION

Citation:

Bioinformation. 2007 Apr 10;1(10):414-9.
Order-restricted inference for ordered gene expression (ORIOGEN) data under heteroscedastic variances.
Simmons SJ, Peddada SD.

MVQueries – Classify Short Gene Expression Time-courses

MVQueries

:: DESCRIPTION

MVQueries is a software of classifying short gene expression time-courses. Short gene expression time-courses monitoring response to toxins are represented as piecewise constant functions, which are modeled as left–right Hidden Markov Models. Our software implements a Bayesian approach to parameter estimation and in inference. Compared to previously published work, we improve prediction accuracy by 7 and 4%, respectively, when classifying toxicology and stress response data and e also reduce running times by at least a factor of 140.

::DEVELOPER

Alexander Schliep’s group for bioinformatics

:: SCREENSHOTS

N/A

:: REQUIREMENTS

:: DOWNLOAD

  MVQueries

:: MORE INFORMATION

Citation

Bioinformatics. 2011 Apr 1;27(7):946-52. Epub 2011 Jan 25.
Classifying short gene expression time-courses with Bayesian estimation of piecewise constant functions.
Hafemeister C, Costa IG, Sch?nhuth A, Schliep A.


GQL 1.0 – GHMM-based tool for Querying and Clustering Gene-Expression time-course data

GQL 1.0

:: DESCRIPTION

GQL (Graphical Query Language) is a suite of tools for analyizing time-course experiments. Currently, it is adapted to gene expression data. The two main tools are GQLQuery, for querying data sets, and GQLCluster, which provides a way for computing groupings based on a number of methods (model-based clustering using HMMs as cluster models and estimation of a mixture of HMMs).

::DEVELOPER

Alexander Schliep’s group for bioinformatics

:: SCREENSHOTS

N/A

:: REQUIREMENTS

:: DOWNLOAD

 GQL

:: MORE INFORMATION

Citation

Bioinformatics. 2005 May 15;21(10):2544-5. Epub 2005 Feb 8.
The Graphical Query Language: a tool for analysis of gene expression time-courses.
Costa IG, Schönhuth A, Schliep A.

CurveSOM – Curve-based Custering of Time Course Expression data

CurveSOM

:: DESCRIPTION

CurveSOM is a new clustering algorithm of curve-based custering of time course expression data . It first present each gene by a cubic smoothing spline that is fitted to its time course expression data and then group genes into clusters by applying a self-organizing map-based clustering on the resulting splines. CurveSOM is a very promising tool for the exploratory analysis of time course expression data, as it is not only able to group genes into clusters with high accuracy but also able to find true time-shifted correlations of expression patterns between clusters.

::DEVELOPER

Chen Xin

:: SCREENSHOTS

N/A

:: REQUIREMENTS

  • Windows

:: DOWNLOAD

 CurveSOM

:: MORE INFORMATION

Citation

X. Chen.
Curve-based clustering of time course gene expression data using self-organizing maps.
Journal of Bioinformatics and Computational Biology, vol. 7, no. 4, 645-661, 2009..