CompClust 1.2 – Explore and Quantify Relationships between Clustering Results

CompClust 1.2

:: DESCRIPTION

CompClust is a python package written using the pyMLX and IPlot APIs. It provides software tools to explore and quantify relationships between clustering results. Its development has been largely built around needs of microarray data analysis but could be easily used in other domains.

::DEVELOPER

the Wold Lab

:: SCREENSHOTS

N/A

:: REQUIREMENTS

:: DOWNLOAD

 CompClust

:: MORE INFORMATION

Citation:

Nucleic Acids Res. 2005 May 10;33(8):2580-94. Print 2005.
A mathematical and computational framework for quantitative comparison and integration of large-scale gene expression data.
Hart CE, Sharenbroich L, Bornstein BJ, Trout D, King B, Mjolsness E, Wold BJ.

MatrixClust 20080804 – Fuzzy Clustering of a Symmetric Matrix

MatrixClust 20080804

:: DESCRIPTION

MatrixClustis a Matlab toolbox for fuzzy clustering of a symmetric matrix, typically the weighted adjacency matrix of an undirected network. The algorithm is an improved version of the fuzzy clustering algorithm .

::DEVELOPER

Bioinformatics & Systems Biology

:: SCREENSHOTS

N/A

:: REQUIREMENTS

:: DOWNLOAD

 MatrixClust

:: MORE INFORMATION

Citation:

Joshi, A., Van de Peer, Y., Michoel, T. (2008)
Analysis of a Gibbs sampler method for model based clustering of gene expression data. 
Bioinformatics 24, 176-83.

GaneSh – Cluster Expression Data by Gibbs sampling procedure

GaneSh

:: DESCRIPTION

GaneSh is a software to cluster expression data by Gibbs sampling procedure

::DEVELOPER

Bioinformatics & Systems Biology

:: SCREENSHOTS

N/A

:: REQUIREMENTS

  • Linux/windows/MacOsX
  • Java

:: DOWNLOAD

 GaneSh

:: MORE INFORMATION

Citation:

Joshi, A., Van de Peer, Y., Michoel, T. (2008)
Analysis of a Gibbs sampler method for model based clustering of gene expression data.
Bioinformatics 24, 176-83.

psi-square 1.2 – Search the Space of Gene Vectors

psi-square 1.2

:: DESCRIPTION

psi-square is a program for searching the space of gene vectors. The program starts with a gene vector, i.e., the set of measurements associated with a gene, and finds similar vectors, derives a probabilistic model of these vectors, then repeats search using this model as a query, and continues to update the model and search again, until convergence. When applied to three different pathway-discovery problems, psi-square was generally more sensitive and sometimes more specific than the ad hoc methods developed for solving each of these problems before.

::DEVELOPER

Bioinformatics Center and IT Group @ Stowers Institute for Medical Research

:: SCREENSHOTS

N/A

:: REQUIREMENTS

  • Windows / MacOsX /  Linux
  • Python

:: DOWNLOAD

 psi-square

:: MORE INFORMATION

Citation

Galina Glazko, Michael Coleman and Arcady Mushegian
Similarity searches in genome-wide numerical data sets
Biology Direct 2006, 1:13

CRC 1.1 – Dirichlet Process Model-based Cluster

CRC 1.1

:: DESCRIPTION

CRC (Chinese Restaurant Cluster) implements a model-based Bayesian clustering algorithm. The cluster assignment procedure can be regarded as following a iterative Chinese restaurant process. This program is designed to cluster microarray gene expression data collected from multiple experiments. missing data is allowed. The program is written in C++, and can be run under Linux, Unix, Windows, MAC OSX operating system as a command line exexutable. CRC has the following features comparing to other clustering tools: 1) able to infer number of clusters, 2) able to cluster genes displaying time-shifted and/or inverted correlations, 3) able to tolerate missing genotype data and 4) provide confidence measure for clusters generated. Here is some more details on why you should try CRC for your microarray data analysis.

CRC Online Version

::DEVELOPER

Steve Qin @ the Center for Statistical Genetics

:: SCREENSHOTS

N/A

:: REQUIREMENTS

  • Linux /  Windows / MacOsX

:: DOWNLOAD

 CRC

:: MORE INFORMATION

Citation

Qin ZS.
Clustering microarray gene expression data using weighted Chinese restaurant process.
Bioinformatics. 2006 Aug 15;22(16):1988-97. Epub 2006 Jun 9.

VIZARD 1.2 – Affymetrix GeneChip® Data Analysis & Visualization

VIZARD 1.2

:: DESCRIPTION

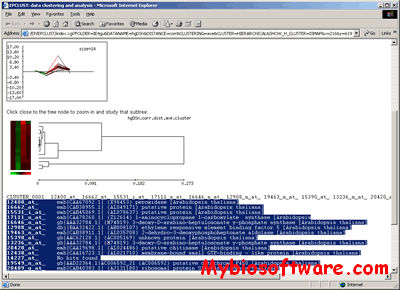
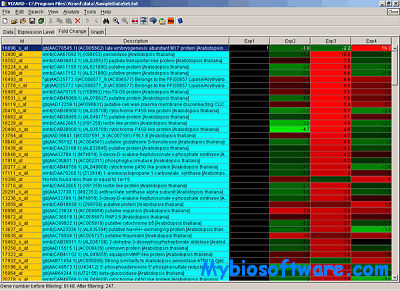
VIZARD is a Java program for analysis and visualization of Affymetrix GeneChip® data.VIZARD includes several integrated tools for filtering, sorting, clustering and visualization of gene expression data as well as tools for discovery of regulatory motifs in upstream sequences. It also includes annotation and upstream sequence databases for the majority of genes represented on the Affymetrix Arabidopsis 8K GeneChip® array.

When VIZARD was created its name originated from VIsualiZe microARray Data. Now it does much more than visualization of gene expression data, however, we have decided to keep the name.

::DEVELOPER

Nick Moseyko

:: SCREENSHOTS

:: REQUIREMENTS

:: DOWNLOAD

VIZARD

:: MORE INFORMATION

It is available free of charge for educational, research, and not-for-profit purposes. To read full text of the terms under which the program is distributed, click here.

MAGIC Tool 2.1 – MicroArray Genome Imaging & Clustering Tool

MAGIC Tool 2.1

:: DESCRIPTION

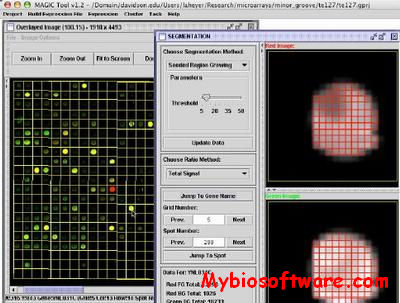
MAGIC Tool is an integrated microarray data analysis software.

The purpose of MAGIC Tool is to allow the user to begin with DNA microarray tiff files and end with biologically meaningful information. Comparative hybridization data (glass chips) and Affymetrix data are compatible with MAGIC Tool. You can start with tiff files or expression files.

MAGIC Tool allows the user to change parameters for clustering, data quantification etc.

::DEVELOPER

Laurie Heyer

:: SCREENSHOTS

:: REQUIREMENTS

  • Windows/Mac/ Linux/ UNIX
  • Java

:: DOWNLOAD

MAGIC Tool ;  User’s Guide

:: MORE INFORMATION

Free software with open source.

Paper: MAGIC Tool: Integrated microarray data analysis (Bioinformatics, 2005)

Venn Mapper 1.01 – Compare Heterologous Microarray Data Sets

Venn Mapper 1.01

:: DESCRIPTION

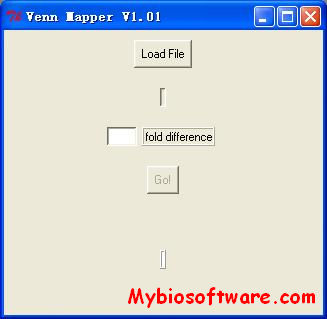
Venn Mapper is a program that cluster heterologous microarray data based on the number of co-occurring differentially expressed genes. The application loads microarray data (gene expression ratios) and determines which genes are up- or down-regulated by a user-defined ratio cut-off level. For each experiment, lists of differentially expressed genes are computed. Every list will be compared to every other list, and the number of co-occurring genes will be calculated. With the use of the binomial distribution, so called z-values can be assigned to the overlap found between two lists. The z-values can be directly imported into the Cluster and/or TreeView software.

::DEVELOPER

Marcel Smid

:: SCREENSHOTS

:: REQUIREMENTS

  • Windows/ Other OS with Perl

:: DOWNLOAD

Venn Mapper for Win ; Perl Resource Code

:: MORE INFORMATION

Citation:

M. Smid ,L.C.J. Dorssers, G. Jenster, Venn Mapping: clustering of heterologous microarray data based on the number of co-occurring differentially expressed genes, Bioinformatics (2003) 19 (16): 2065-2071.

ArrayMiner 5.3 – Microarray Gene Expression Data Analysis

ArrayMiner 5.3

:: DESCRIPTION

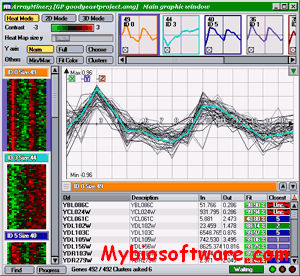
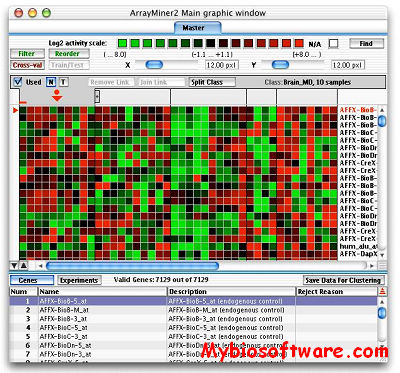
ArrayMiner® is a set of analysis tools using advanced algorithms to reveal the true structure of your gene expression data. Its unique graphical interface gives you an intimate understanding of the analysis and an easy publishing of its results.

ArrayMiner include clustering module & classmarking module.

::DEVELOPER

Optimal Design

:: SCREENSHOTS

:: REQUIREMENTS

  • Windows / Mac OsX

:: DOWNLOAD

ArrayMiner Demo / Free Lite

:: MORE INFORMATION

In order to be eligible for the free light version, your institution must be academic. The light version is limited to 500 genes and 10 experiments for the clustering module and 500 genes for the ClassMarker tool. The light licence’s validity is 1 year.

Price List.

Samster 2.0 – SAM to Cluster

Samster 2.0

:: DESCRIPTION

After doing a SAM analysis, you will want a more visual representation, or want to see if there is even more detailed substructure within these genes by using Cluster. Samster will take an Excel spreadsheet or text files and extract the raw data into a text output file, which can be fed directly into Cluster or opened in Treeview. Samster circumvents the need to create databases each time you wish to accomplish this task.

::DEVELOPER

Falkow Lab

:: SCREENSHOTS

:: REQUIREMENTS

  • Windows / Mac Os / Linux
  • Excel
  • Perl
  • TK

:: DOWNLOAD

Samster for WinSource Code ; Manual ; Sample input file

:: MORE INFORMATION

The software is copyrighted under the terms of the GNU General Public License. You can view this license at http://www.gnu.org/licenses/gpl.txt.

If you use SAMster, please cite:
Mueller A, O’Rourke J, Chu P, Kim CC, Sutton P, Lee A, Falkow S.
Protective immunity against Helicobacter is characterized by a unique transcriptional signature.
Proc Natl Acad Sci U S A. 2003 Oct 14;100(21):12289-94.