StoatyDive v1.1.0 – Evaluation and Classification of Peak Profiles for Sequencing data

StoatyDive v1.1.0

:: DESCRIPTION

StoatyDive is a tool to evaluate and classify predicted peak profiles to assess the binding specificity of a protein to its targets. It can be used for sequencing data such as CLIP-seq or ChIP-Seq, or any other type of peak profile data.

::DEVELOPER

Bioinformatics Group Albert-Ludwigs-University Freiburg

:: SCREENSHOTS

N/A

:: REQUIREMENTS

  • Linux

:: DOWNLOAD

StoatyDive

:: MORE INFORMATION

Citation

Heyl F, Backofen R.
StoatyDive: Evaluation and classification of peak profiles for sequencing data.
Gigascience. 2021 Jun 18;10(6):giab045. doi: 10.1093/gigascience/giab045. PMID: 34143874; PMCID: PMC8212874.

ODIN 0.4.1 – Detecting Differential Peaks in ChIP-seq Signals

ODIN 0.4.1

:: DESCRIPTION

ODIN is a HMM-based approach to detect and analyse differential peaks in pairs of ChIP-seq data. It is the first differential peak caller that performs genomic signal processing, peak calling and p-value calculation in an integrated framework.

::DEVELOPER

IZKF Computational Biology and Bioinformatics Research Group

:: SCREENSHOTS

N/A

:: REQUIREMENTS

  • Linux
  • Python

:: DOWNLOAD

 ODIN

:: MORE INFORMATION

Citation:

Detecting differential peaks in ChIP-seq signals with ODIN.
Allhoff M, Seré K, Chauvistré H, Lin Q, Zenke M, Costa IG.
Bioinformatics. 2014 Nov 3. pii: btu722.

MSPC 5.4.0 – Using Combined Evidence from Replicates to Evaluate ChIP-seq Peaks

MSPC 5.4.0

:: DESCRIPTION

Given a set of peaks from (biological or technical) replicates, MSPC combines the p-values of overlapping enriched regions: users can choose a threshold on the combined significance of overlapping peaks and set a minimum number of replicates where the overlapping peaks should be present. The method allows the “rescue” of weak peaks occuring in more than one replicate and outputs a new set of enriched regions for each replicate.

::DEVELOPER

MSPC team

:: SCREENSHOTS

N/A

:: REQUIREMENTS

  • Linux / Windows / MacOsX

:: DOWNLOAD

 MSPC

:: MORE INFORMATION

Citation

Using combined evidence from replicates to evaluate ChIP-seq peaks.
Jalili V, Matteucci M, Masseroli M, Morelli MJ.
Bioinformatics. 2015 May 7. pii: btv293.

MassSpec 1.1 – Peak list Extraction from Proteomic Mass Spectra

MassSpec 1.1

:: DESCRIPTION

MassSpecis a MATLAB implementation of the peak list extraction procedure

::DEVELOPER

laboratorio di Bioinformatica e Biologia Sintetica – Univ. of Pavia

:: SCREENSHOTS

N/A

:: REQUIREMENTS

  • Linux / Mac OsX / Windows
  • Matlab

:: DOWNLOAD

 MassSpec

:: MORE INFORMATION

Citation

BMC Bioinformatics 2010, 11:518 doi:10.1186/1471-2105-11-518
Accurate peak list extraction from proteomic mass spectra for identification and profiling studies.
Barbarini N, Magni P.

Q v1.2.0 – Saturation-based ChIP-seq Peak Caller

Q v1.2.0

:: DESCRIPTION

Q is a fast saturation-based ChIP-seq peak caller. Q works well in conjunction with the irreproducible discovery rate (IDR) procedure.

::DEVELOPER

The Computational Biology @ Charité Berlin

:: SCREENSHOTS

N/A

:: REQUIREMENTS

  • Linux

:: DOWNLOAD

 Q

:: MORE INFORMATION

Citation

Genome Res. 2015 Sep;25(9):1391-400. doi: 10.1101/gr.189894.115.
Saturation analysis of ChIP-seq data for reproducible identification of binding peaks.
Hansen P, Hecht J, Ibrahim DM, Krannich A, Truss M, Robinson PN.

PolyaPeak 0.4 – ChIP-seq Peak Reranking tool using mixture of Multivariate Polya Ditributions

PolyaPeak 0.4

:: DESCRIPTION

PolyaPeak is an R package for ranking ChIP-seq peaks with shape information. polyaPeak uses a Bayesian hierarchical model to incorporate the peak shapes in the ranking. The shapes are described by a mixture of multivariate Polya distributions. Real data analyses show that polyaPeak outperforms several popular peak calling software including MACS, CisGenome and PICS.

::DEVELOPER

Hao Wu, Ph.D.

:: SCREENSHOTS

N/A

:: REQUIREMENTS

  • Windows /Linux/ MacOsX
  • R

:: DOWNLOAD

 PolyaPeak

:: MORE INFORMATION

Citation

PLoS One. 2014 Mar 7;9(3):e89694. doi: 10.1371/journal.pone.0089694. eCollection 2014.
PolyaPeak: detecting transcription factor binding sites from ChIP-seq using peak shape information.
Wu H1, Ji H

JAMM 1.0.8 – Peak Finder for NGS Datasets

JAMM 1.0.8

:: DESCRIPTION

JAMM (Joint Analysis of NGS replicates via Mixture Model clustering)is a peak finder for NGS datasets that can integrate replicates and assign peak boundaries accurately.

::DEVELOPER

JAMM team

:: SCREENSHOTS

N/A

:: REQUIREMENTS

  • Linux
  • Perl

:: DOWNLOAD

 JAMM

:: MORE INFORMATION

Citation:

JAMM: A Peak Finder for Joint Analysis of NGS Replicates.
Ibrahim MM, Lacadie SA, Ohler U.
Bioinformatics. 2014 Sep 15. pii: btu568.

PeptideReranking – Peptide Re-ranking with Protein-peptide Correspondence and Precursor Peak Intensity Information

PeptideReranking

:: DESCRIPTION

PeptideReranking includes three peptide reranking methods: PPMRanker, PPIRanker, and MIRanker. PPMRanker only uses Protein-Peptide Map (PPM) information from the protein database, PPIRanker only uses Precursor Peak Intensity (PPI) information, and MIRanker employs both PPM information and PPI information.

::DEVELOPER

Laboratory for Bioinformatics and Computational Biology, HKUST

:: SCREENSHOTS

N/A

:: REQUIREMENTS

:: DOWNLOAD

 PeptideReranking

:: MORE INFORMATION

Citation:

IEEE/ACM Trans Comput Biol Bioinform. 2012 Jul-Aug;9(4):1212-9. doi: 10.1109/TCBB.2012.29.
Peptide reranking with protein-peptide correspondence and precursor peak intensity information.
Yang C1, He Z, Yang C, Yu W.

MIMA v1.0 – Automation of the MS to IMS Peak Assignment

MIMA v1.0

:: DESCRIPTION

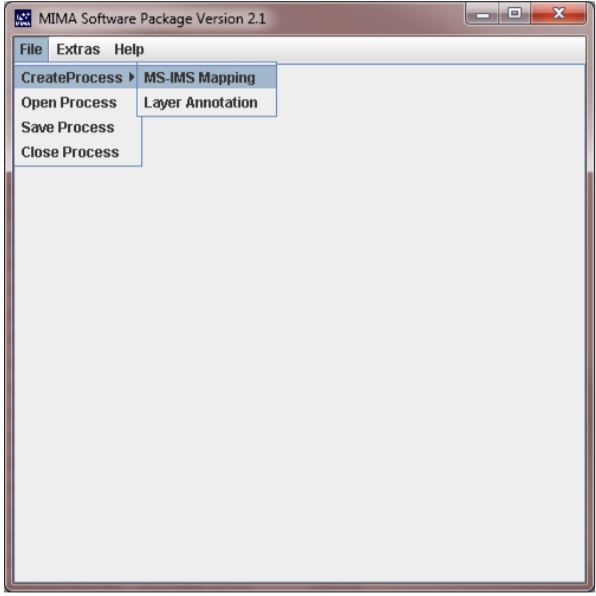
MIMA is a method for the alignment of GC/MS data and MCC/IMS data facilitating the identification of biomarker molecules.

::DEVELOPER

Baumbach lab

:: SCREENSHOTS

:: REQUIREMENTS

  • Linux / Windows / MacOsX
  • Java

:: DOWNLOAD

MIMA

:: MORE INFORMATION

Citation

Maurer F, Hauschild AC, Eisinger K, Baumbach J, Mayor A, Baumbach JI (2014).
MIMA – A software for analyte identification in MCC/IMS chromatograms by mapping accompanying GC/MS measurements.
Int. J. Ion Mobil. Spec. Volume 17, Issue 2, pp 95-101.

ChIPseeker 1.22.0 – ChIP peak Annotation, Comparison & Visualization

ChIPseeker 1.22.0

:: DESCRIPTION

ChIPseeker is an R package for annotating ChIP-seq data analysis.

::DEVELOPER

Guangchuang YU,

:: SCREENSHOTS

N/a

:: REQUIREMENTS

  • Linux/MacOsX
  • R
  • Bioconductor

:: DOWNLOAD

 ChIPseeker

:: MORE INFORMATION

Citation:

ChIPseeker: an R/Bioconductor package for ChIP peak annotation, comparison and visualization.
Yu G, Wang LG, He QY.
Bioinformatics. 2015 Mar 11. pii: btv145.