nnNorm 2.56.0 – Spatial and Intensity based Normalization of cDNA Microarray data

nnNorm 2.56.0

:: DESCRIPTION

nnNorm is an algorithm designed to remove intensity and spatial dependent biases from microarray expression data sets. It uses robust neural networks to fit the log-ratios on spatial coordinates and log-average intensity of the cDNA spots.

::DEVELOPER

the Bioinformatics and Computational Biology Unit of the Perinatology Research Branch (NICHD)

:: SCREENSHOTS

N/A

:: REQUIREMENTS

  • Windows / Linux / MacOS
  • R package
  • Bioconductor

:: DOWNLOAD

  nnNorm

:: MORE INFORMATION

Citation

Tarca AL, Cooke JE, Mackay J.
A robust neural networks approach for spatial and intensity-dependent normalization of cDNA microarray data.
Bioinformatics 2005;21(11):2674-83.

PeptideReranking – Peptide Re-ranking with Protein-peptide Correspondence and Precursor Peak Intensity Information

PeptideReranking

:: DESCRIPTION

PeptideReranking includes three peptide reranking methods: PPMRanker, PPIRanker, and MIRanker. PPMRanker only uses Protein-Peptide Map (PPM) information from the protein database, PPIRanker only uses Precursor Peak Intensity (PPI) information, and MIRanker employs both PPM information and PPI information.

::DEVELOPER

Laboratory for Bioinformatics and Computational Biology, HKUST

:: SCREENSHOTS

N/A

:: REQUIREMENTS

:: DOWNLOAD

 PeptideReranking

:: MORE INFORMATION

Citation:

IEEE/ACM Trans Comput Biol Bioinform. 2012 Jul-Aug;9(4):1212-9. doi: 10.1109/TCBB.2012.29.
Peptide reranking with protein-peptide correspondence and precursor peak intensity information.
Yang C1, He Z, Yang C, Yu W.

QPROT 1.3.5 – Differential Protein Expression using Spectral Count and Intensity data.

QPROT 1.3.5

:: DESCRIPTION

QPROT is a software for differential protein expression using spectral count and intensity data. It also accounts for independent samples and paired samples.

::DEVELOPER

Proteomics & Integrative Bioinformatics Lab

:: SCREENSHOTS

N/A

:: REQUIREMENTS

  • Linux

:: DOWNLOAD

 QPROT

:: MORE INFORMATION

Citation:

QPROT: Statistical method for testing differential expression using protein-level intensity data in label-free quantitative proteomics.
Choi H, Kim S, Fermin D, Tsou CC, Nesvizhskii AI.
J Proteomics. 2015 Nov 3;129:121-6. doi: 10.1016/j.jprot.2015.07.036.

Evoker 2.2 – Graphical Tool for Visualising Genotype Intensity data

Evoker 2.2

:: DESCRIPTION

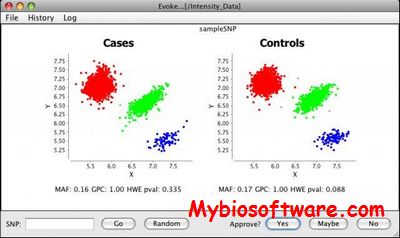
Evoker is a graphical tool for visualizing genotype intensity data in order to assess genotype calls as part of quality control procedures for genome-wide association studies.

::DEVELOPER

James Morris or Jeff Barrett.

:: SCREENSHOTS

:: REQUIREMENTS

  • Linux / MacOsX / Windows
  • Java

:: DOWNLOAD

 Evoker

:: MORE INFORMATION

Citation

Evoker: a visualization tool for genotype intensity data.
Morris JA, Randall JC, Maller JB and Barrett JC
Bioinformatics (Oxford, England) 2010;26;14;1786-7