expVIP 20180914 – RNA-seq Data Analysis and Visualization Platform

expVIP 20180914

:: DESCRIPTION

ExpVIP (expression visualization and integration platfor) is a tool that enables the integration of different RNA-Seq studies by analysing the data uniformly across experiments and provides a web interface to query the data.

::DEVELOPER

the Earlham Institute.

:: SCREENSHOTS

N/A

:: REQUIREMENTS

  • Linux

:: DOWNLOAD

expVIP

:: MORE INFORMATION

Citation

expVIP: a Customizable RNA-seq Data Analysis and Visualization Platform.
Borrill P, Ramirez-Gonzalez R, Uauy C.
Plant Physiol. 2016 Apr;170(4):2172-86. doi: 10.1104/pp.15.01667.

MetaR 2.0.2 – Data Analysis with the R Ecosystem

MetaR 2.0.2

:: DESCRIPTION

MetaR (Metaprogramming in R) takes advantage of Language Workbench Technology to facilitate data analysis with the R language.

::DEVELOPER

Campagne Laboratory

:: SCREENSHOTS

N/A

:: REQUIREMENTS

  • Linux / Windows / MacOsX
  • R

:: DOWNLOAD

MetaR

:: MORE INFORMATION

Citation

Fabien Campagne, William ER Digan, Manuele Simi
MetaR: simple, high-level languages for data analysis with the R ecosystem
bioRxiv 2015 doi: http://dx.doi.org/10.1101/030254

PopGenome 2.7.1 – Data Analysis in Population Genetics

PopGenome 2.7.1

:: DESCRIPTION

The PopGenome library provides data analysis in population genetics and is programmed in the powerful, open-source, statistical computing environment R. Several polymorphism statistics, such as the number of segregating sites and nucleotide or haplotype diversity based FST measurements can be calculated. In addition, PopGenome contributes a lot of neutrality statistics such as the Tajima D and Rozas R2 test. Testing of the significance of these statistics requires generating bootstrap samples from a neutral model using a coalescent approach.

::DEVELOPER

Computational Cell Biology,   Heinrich-Heine-Universität Düsseldorf

:: SCREENSHOTS

N/A

:: REQUIREMENTS

:: DOWNLOAD

 PopGenome

:: MORE INFORMATION

Citation:

Mol Biol Evol. 2014 Jul;31(7):1929-36. doi: 10.1093/molbev/msu136. Epub 2014 Apr 16.
PopGenome: an efficient Swiss army knife for population genomic analyses in R.
Pfeifer B, Wittelsbürger U, Ramos-Onsins SE, Lercher MJ

Mayday 2.14 – Microarray Data Analysis

Mayday 2.14

:: DESCRIPTION

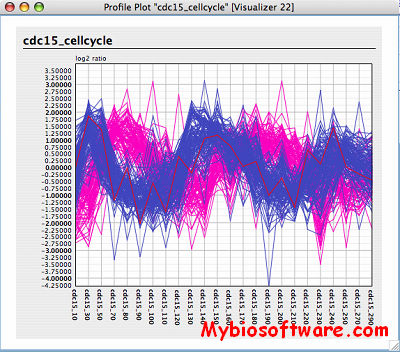
Mayday (Microarray Data Analysis)is a workbench for visualization, analysis and storage of microarray data.

Mayday offers a variety of plug-ins, such as various interactive viewers, a connection to the R statistical environment, a connection to SQL-based databases, and different clustering methods, including phylogenetic methods.

In addition, so-called meta information objects are provided for annotation of the microarray data allowing integration of data from different sources. This meta information can be used to enhance visualizations, such as in the enhanced heatmap visualization.

::DEVELOPER

Research Group “Integrative Transcriptomics” , Center for Bioinformatics Tübingen, University of Tübingen

:: SCREENSHOTS

:: REQUIREMENTS

:: DOWNLOAD

Mayday

:: MORE INFORMATION

Citation

Florian Battke, Stephan Symons and Kay Nieselt: Mayday – Integrative analytics for expression data;
BMC Bioinformatics 11 (1):121 (2010)

ArrayTrack 3.5.0 — Microarray Database, Data analysis & Interpretation tool

ArrayTrack 3.5.0

:: DESCRIPTION

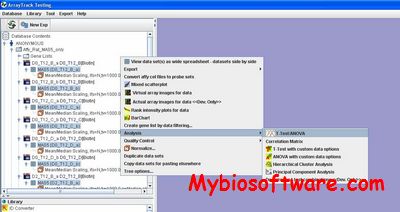
ArrayTrack is a Food and Drug Administration (FDA) bioinformatics tool that has been widely adopted by the research community for genomics studies. It provides an integrated environment for microarray data management, analysis and interpretation. Most of its functionality for statistical, pathway and gene ontology analysis can also be applied independently to data generated by other molecular technologies.

::DEVELOPER

the National Center for Toxicological Research (NCTR).

:: SCREENSHOTS

:: REQUIREMENTS

  • Linux/Windows/MacOsX
  • Java

:: DOWNLOAD

 ArrayTrack

:: MORE INFORMATION

Citation

ArrayTrack: a free FDA bioinformatics tool to support emerging biomedical research–an update.
Xu J, Kelly R, Fang H, Tong W.
Hum Genomics. 2010 Aug;4(6):428-34. Review.

Cyflogic 1.2.1 – Flow Cytometry Data Analysis Tool

Cyflogic 1.2.1

:: DESCRIPTION

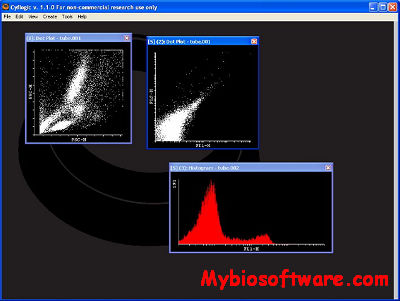
Cyflogic is a flow cytometry data analysis tool for Microsoft Windows enviroment. It has all “regular” analysis capabilities, such as dot plot, histogram and statistics. In addition, Cyflogic offers new innovative tools for your data analysis.

::DEVELOPER

CyFlo Ltd.

:: SCREENSHOTS

:: REQUIREMENTS

  • Windows

:: DOWNLOAD

Cyflogic

:: MORE INFORMATION

qbasePLUS 2.0 – Real-time PCR Data Analysis

qbasesPLUS 2.0

:: DESCRIPTION
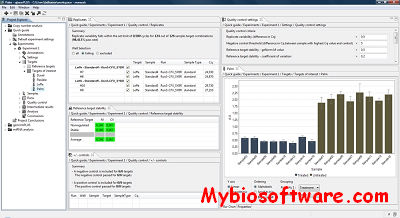
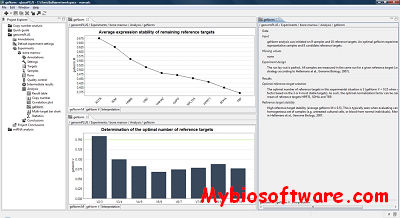
qbasePLUS speeds up the analysis of qPCR data and improves the accuracy of your experiments. The software is the most powerful, flexible, and user-friendly real-time PCR data-analysis software based on the proven geNorm and qBase technology, enhanced with proprietary algorithms and time-saving features.

::DEVELOPER

Biogazelle

:: SCREENSHOTS

:: REQUIREMENTS

  • Linux / Windows / Mac OsX

:: DOWNLOAD

qbasePLUS

:: MORE INFORMATION

Citation

Vandesompele et al.,
Accurate normalization of real-time quantitative RT-PCR data by geometric averaging of multiple internal control genes
Genome Biology, 2002

ChipInspector 2.1 – Microarray Data Analysis

ChipInspector 2.1

:: DESCRIPTION

ChipInspector is Genomatix tool for high quality microarray data analysis. Based on single probes instead of probe sets results of superior significance can be retrieved in combination with the Genomatix genome annotation. Expression levels can be assigned not only to genes but to separate (alternative) transcripts.

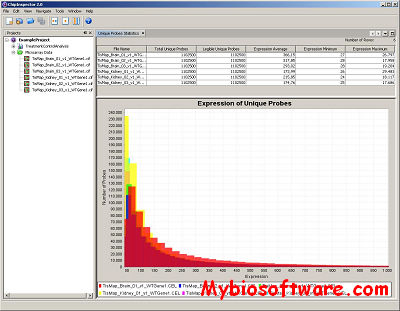
ChipInspector analyzes raw data files from microarray experiments. It selects those probes from the chip, where the signal is significantly different from the background and puts them in their biological context.

ChipInspector works with data from exon-, tiling- or gene expression-arrays from vendors like Affymetrix, Illumina or Agilent.

::DEVELOPER

Genomatix Software GmbH

:: SCREENSHOTS

:: REQUIREMENTS

:: DOWNLOAD

ChipInspector

:: MORE INFORMATION