CARMAweb 1.3 – R- and Bioconductor-based web service for Microarray Data Analysis

CARMAweb 1.3

:: DESCRIPTION

CARMAweb (Comprehensive R-based Microarray Analysis web service) is a web application designed for the analysis of microarray data. CARMAweb performs data preprocessing (background correction, quality control and normalization), detection of differentially expressed genes, cluster analysis, dimension reduction and visualization, classification, and Gene Ontology-term analysis. This web application accepts raw data from a variety of imaging software tools for the most widely used microarray platforms: Affymetrix GeneChips, spotted two-color microarrays and Applied Biosystems (ABI) microarrays.

::DEVELOPER

Genomics & Bioinformatics Graz, Graz University of Technology

:: SCREENSHOTS

N/A

:: REQUIREMENTS

:: DOWNLOAD

 CARMAweb

:: MORE INFORMATION

Citation

Rainer J., Sanchez-Cabo F., Stocker G., Sturn A. and Trajanoski Z.
CARMAweb: comprehensive R- and Bioconductor-based web service for microarray data analysis
Nucleic Acids Research, 2006 vol 34(Web Server Issue):W498-503.

CHROMOWAVE 1.0 – Microarrays Data Analysis

CHROMOWAVE 1.0

:: DESCRIPTION

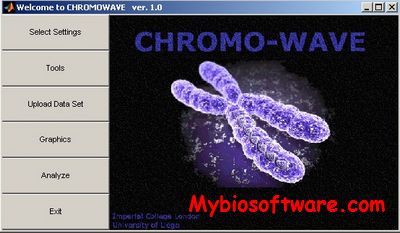
CHROMOWAVE is a toolbox written for Matlab 7. It performs pre-processing and analysis of microarray data. Although it was designed for Affymetrix microarrays, its use can be extended to other microarray data. Code is optimized in regards to memory use and speed. Pre-processing tools include array normalization and data matrix manipulations. Analysis tools include analysis of variance (paired, group and ANOVA analyses, correlation analysis, gene-classifiers) with  relative multiple hypothesis testing corrections (FWER, FDR etc), analysis of co-variance (singular value decomposition. For Affymetrix data only, CHROMOWAVE can perform chromosomal analysis

::DEVELOPER

Dr Federico E Turkheimer

:: SCREENSHOTS

:: REQUIREMENTS

  • Linux / Windows/ MacOsX
  • Matlab

:: DOWNLOAD

 CHROMOWAVE

:: MORE INFORMATION

Citation

Federico E Turkheimer et al.
Chromosomal patterns of gene expression from microarray data: methodology, validation and clinical relevance in gliomas
BMC Bioinformatics 2006, 7:526

PASS 2 – Control the FDR level in ChIP data analysis

PASS 2

:: DESCRIPTION

PASS (Poisson Approximation for Statistical Significance) is a software that can accurately control the FDR level in ChIP data analysis. The method is designed for detecting transcription factor binding, and may not work well for wide spread signals such as nucleopositioning data. If the data is from ChIP-seq, you need to convert each ChIP-seq value into z-scores before using this program.

::DEVELOPER

Yu Zhang

:: SCREENSHOTS

N/A

:: REQUIREMENTS

  • Linux

:: DOWNLOAD

 PASS

:: MORE INFORMATION

Citation

Bioinformatics. 2008 Dec 15;24(24):2825-31. Epub 2008 Oct 25.
Poisson approximation for significance in genome-wide ChIP-chip tiling arrays.
Zhang Y.

DART-PCR 1.0 – Quantitative Real-time PCR Data Analysis

DART-PCR 1.0

:: DESCRIPTION

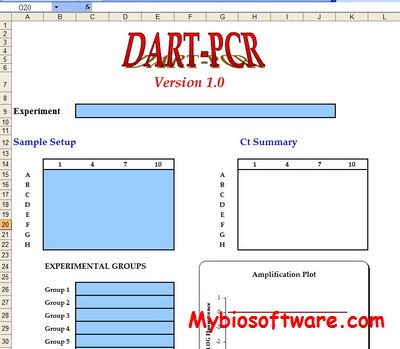
DART-PCR (Data Analysis for Real‐Time PCR) provides a simple means of analysing real-time PCR data from raw flurescence data. This allows an automatic calculation of amplification kinetics, as well as performing the subsequent calculations for relative quantification and calculation of assay variability. Amplification efficiencies are also tested to dtect anomalus samples within groups (outlayers) and differences between experimatal groups (amplification equivalence).

::DEVELOPER

Stuart N. Peirson, Jason N. Butler and Russell G. Foster

:: SCREENSHOTS

:: REQUIREMENTS

  • Excel

:: DOWNLOAD

 DART-PCR

:: MORE INFORMATION

Citation

Stuart N. Peirson, Jason N. Butler and Russell G. Foster (2003)
Experimental validation of novel and conventional approaches to quantitative real-time PCR data analysis
Nucl. Acids Res. (2003) 31 (14): e73

Mouse Atlas Data Analysis CD-ROMs 0403

Mouse Atlas Data Analysis CD-ROMs 0403

:: DESCRIPTION

Mouse Atlas data and software is available in a set of CD-ROMs.

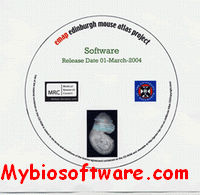
Software CD contains software that can be installed on a users own computer.The software includes the MAPaint and Java WlzViewer programs. These programs allow the user to view the Mouse Atlas 3D models and anatomy domains in any plane. MAPaint can also be used to paint and define arbitrary regions in 2D and 3D space. A suite of utility programs is also included, that enables manipulation of spatial data, and conversion from the Mouse Atlas woolz image format to more common image formats (jpg, tif, etc.).

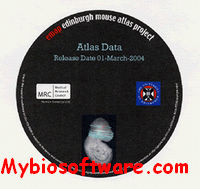
Data CD contain the set of MouseAtlas 3D models.The models can be used in conjunction with the software to browse the 3D structures, identify anatomy components, and prepare data for inclusion in the database of gene expression

::DEVELOPER

 EMAP • Human Genetics Unit • Medical Research Council

:: SCREENSHOTS

:: REQUIREMENTS

  • Windows / Mac OsX

:: DOWNLOAD

  Mouse Atlas Data Analysis CD-ROMs 

:: MORE INFORMATION

FigSys 2.4 – Publication Quality Graph Plotting and Data Analysis

FigSys 2.4

:: DESCRIPTION

FigSys is a program for processing, analyzing and presenting data and creating science documents of all kinds. FigSys is a major advance in Windows graphics software. It is powerful but easily accessible to users of all levels of experience. Turning your data into basic figure types such as line graphs, bar charts, areagrams, drop-plots or scatter diagrams is completely automatic and there are endless refinements which can be added with the simple-to-use tools. Text-only charts can be created and 3D data graphing is also included.

::DEVELOPER

Biosoft

:: SCREENSHOTS

:: REQUIREMENTS

  • Windows

:: DOWNLOAD

FigSys

:: MORE INFORMATION

Ordering


Ginkgo 1.01 – CGH & Expression Microarray Data Analysis & Normalization

Ginkgo 1.01

:: DESCRIPTION

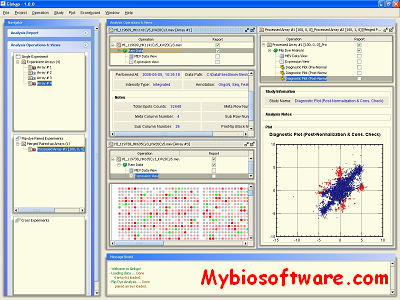
Ginkgo is a spotted microarray data pre-processing platform featuring analysis functionalities for CGH (Comparative Genomic Hybridization) and expression data. This application provides a user-friendly graphical interface that allows viewing, analyzing, generating and reporting microarray data, easily and intuitively. Within the software there are a number of algorithms to address microarray data analysis needs, including normalization, filtering, data imputation, replicates merge, and expression statistical distribution tests.

::DEVELOPER

J. Craig Venter Institute

:: SCREENSHOTS

:: REQUIREMENTS

  • Linux / Windows
  • JAVA

:: DOWNLOAD

Ginkgo

:: MORE INFORMATION

This application is released under the GPL v3 License: View License

Citation:

Quackenbush, J. Microarray data normalization and transformation. Nature Genetics. Vol.32 supplement pp496-501 (2002).

VIZARD 1.2 – Affymetrix GeneChip® Data Analysis & Visualization

VIZARD 1.2

:: DESCRIPTION

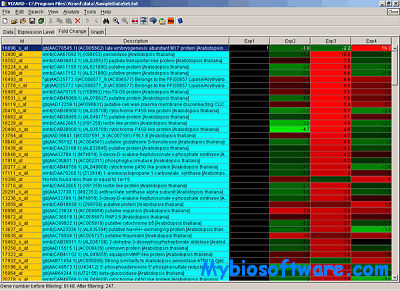
VIZARD is a Java program for analysis and visualization of Affymetrix GeneChip® data.VIZARD includes several integrated tools for filtering, sorting, clustering and visualization of gene expression data as well as tools for discovery of regulatory motifs in upstream sequences. It also includes annotation and upstream sequence databases for the majority of genes represented on the Affymetrix Arabidopsis 8K GeneChip® array.

When VIZARD was created its name originated from VIsualiZe microARray Data. Now it does much more than visualization of gene expression data, however, we have decided to keep the name.

::DEVELOPER

Nick Moseyko

:: SCREENSHOTS

:: REQUIREMENTS

:: DOWNLOAD

VIZARD

:: MORE INFORMATION

It is available free of charge for educational, research, and not-for-profit purposes. To read full text of the terms under which the program is distributed, click here.

Array Tools 3.3 – Dictyostelium Discoideum Microarray Data Analysis

Array Tools 3.3

:: DESCRIPTION

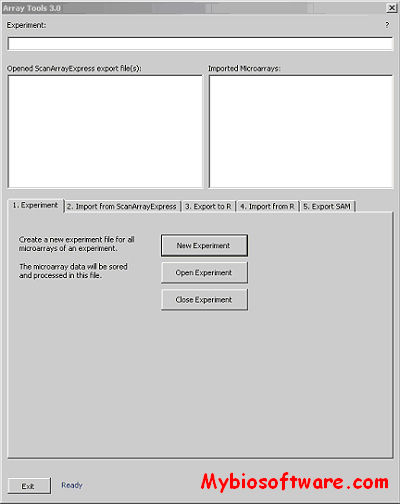
Array Tools is a Microsoft Excel Add-In, which is designed to handle the import and export of Dictyostelium discoideum microarray data. It can be used to:

  • Import ScanArray Express CSV to Excel.
  • Export the data to R by creating Data.spot, R Commands. R and Arrays.txt files.
  • Re-importing data from R to Excel.
  • Exporting data to SAM

::DEVELOPER

Ludwig Eichinger

:: SCREENSHOTS

:: REQUIREMENTS

:: DOWNLOAD

Array Tools

:: MORE INFORMATION

Contact:
Ludwig Eichinger
Institut für Biochemie Köln, Zentrum Biochemie
University of Cologne
http://www.uni-koeln.de/med-fak/biochemie/transcriptomics/

ArrayMiner 5.3 – Microarray Gene Expression Data Analysis

ArrayMiner 5.3

:: DESCRIPTION

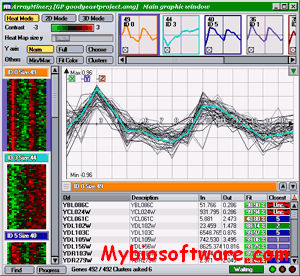
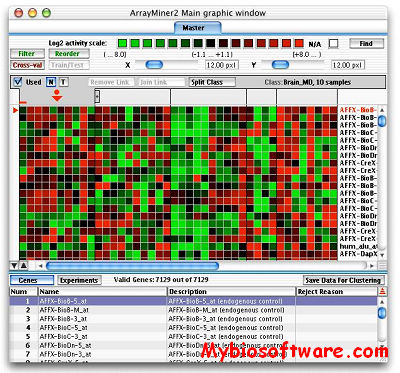
ArrayMiner® is a set of analysis tools using advanced algorithms to reveal the true structure of your gene expression data. Its unique graphical interface gives you an intimate understanding of the analysis and an easy publishing of its results.

ArrayMiner include clustering module & classmarking module.

::DEVELOPER

Optimal Design

:: SCREENSHOTS

:: REQUIREMENTS

  • Windows / Mac OsX

:: DOWNLOAD

ArrayMiner Demo / Free Lite

:: MORE INFORMATION

In order to be eligible for the free light version, your institution must be academic. The light version is limited to 500 genes and 10 experiments for the clustering module and 500 genes for the ClassMarker tool. The light licence’s validity is 1 year.

Price List.