FOCK 1.0 – Frequency of Oligos

FOCK 1.0

:: DESCRIPTION

FOCK Analyzes a FASTA sequence for n-mer frequency (specified by user). Useful for identifying common or rare restriction sites, etc.

::DEVELOPER

Falkow Lab

:: SCREENSHOTS

Command-line interface.

:: REQUIREMENTS

:: DOWNLOAD

FOCK for Win ; Source Code

:: MORE INFORMATION

The software is copyrighted under the terms of the GNU General Public License. You can view this license at http://www.gnu.org/licenses/gpl.txt.

DRACK 3.1 – Differential Restriction Analysis

DRACK 3.1

:: DESCRIPTION

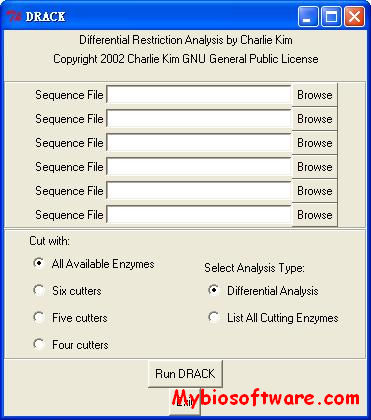
DRACK takes up to 6 FASTA DNA sequence files as input and outputs a tab-delimited text file containing sizes of restriction fragments (which can be opened in a spreadsheet program). Several options are available, including 4-6 base cutters and running in differential or list-all cutters mode. Differential analysis will analyze the sequences and only output restriction enzymes which distinguish between the sequences, while listing all cutters will list even those cutters which do not distinguish between the sequences. This program’s primary purpose was to automatically choose sites to distinguish plasmid clones with an insert in two possible orientations.

::DEVELOPER

Falkow Lab

:: SCREENSHOTS

:: REQUIREMENTS

:: DOWNLOAD

DRACK ; Source Code

:: MORE INFORMATION

The software is copyrighted under the terms of the GNU General Public License. You can view this license at http://www.gnu.org/licenses/gpl.txt.

LD50 Calculators

LD50 Calculators

:: DESCRIPTION

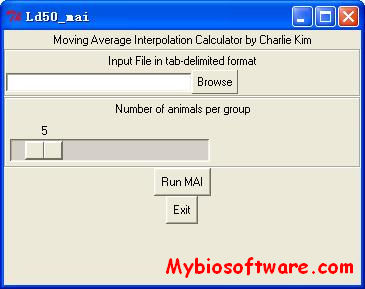
LD50 Calculators can input a tab-delimited text file of surviving mice to caculate LD50 values. LD50 values calculated by Reed-Muench (command-line interface only) or Moving Average Interpolation (graphical interface).

::DEVELOPER

Falkow Lab

:: SCREENSHOTS

:: REQUIREMENTS

  • Windows / Mac Os / Linux
  • Perl
  • TK

:: DOWNLOAD

LD50 Calculators by Reed-Muench (command-line interface only)Reed-Muench sourceby Moving Average Interpolation ; MAI source

:: MORE INFORMATION

The software is copyrighted under the terms of the GNU General Public License. You can view this license at http://www.gnu.org/licenses/gpl.txt.

If you use the LD50 calculators, please cite:
Kim CC, Monack D, Falkow S.
Modulation of virulence by two acidified nitrite-responsive loci of Salmonella enterica serovar Typhimurium.
Infect Immun. 2003 Jun;71(6):3196-205.

COP 0.3 – Competition Plotter

COP 0.3

:: DESCRIPTION

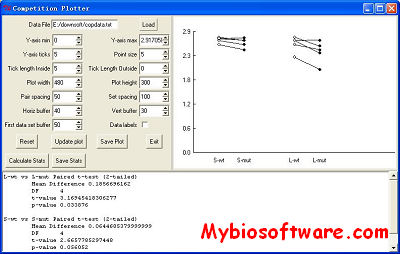
One of the measures of virulence of different strains of an organism is the competitive index. In this model, a mixed infection is performed in a single host with the assumption that the more fit strain will outperform the other. The current standard is to report competitive index (CI), the ratio of recovered colony forming units of one strain to the other. While this information is informative, it discards overall organ-load information due to the one-dimensional nature of the CI.

COP is for generation of plots which preserve this information. Paired t-test statisitcs are calculated.

::DEVELOPER

Falkow Lab

:: SCREENSHOTS

:: REQUIREMENTS

  • Windows / Mac Os / Linux
  • Perl
  • TK

:: DOWNLOAD

COP for WinSource CodeSample data file

:: MORE INFORMATION

The software is copyrighted under the terms of the GNU General Public License. You can view this license at http://www.gnu.org/licenses/gpl.txt.

Samster 2.0 – SAM to Cluster

Samster 2.0

:: DESCRIPTION

After doing a SAM analysis, you will want a more visual representation, or want to see if there is even more detailed substructure within these genes by using Cluster. Samster will take an Excel spreadsheet or text files and extract the raw data into a text output file, which can be fed directly into Cluster or opened in Treeview. Samster circumvents the need to create databases each time you wish to accomplish this task.

::DEVELOPER

Falkow Lab

:: SCREENSHOTS

:: REQUIREMENTS

  • Windows / Mac Os / Linux
  • Excel
  • Perl
  • TK

:: DOWNLOAD

Samster for WinSource Code ; Manual ; Sample input file

:: MORE INFORMATION

The software is copyrighted under the terms of the GNU General Public License. You can view this license at http://www.gnu.org/licenses/gpl.txt.

If you use SAMster, please cite:
Mueller A, O’Rourke J, Chu P, Kim CC, Sutton P, Lee A, Falkow S.
Protective immunity against Helicobacter is characterized by a unique transcriptional signature.
Proc Natl Acad Sci U S A. 2003 Oct 14;100(21):12289-94.

REDUCK 1.0 – Remove Duplicates

REDUCK 1.0

:: DESCRIPTION

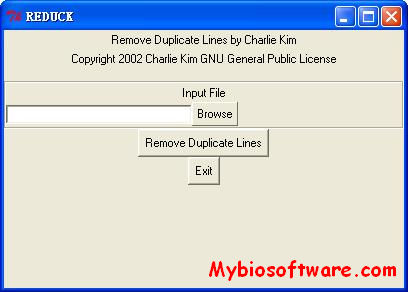
REDUCK removes duplicate lines from a PCL file. Actually, it removes duplicate lines from any text file, but was intended for use with PCL files. Does exactly what it says; if the lines are not 100% identical, they are not removed.

::DEVELOPER

Falkow Lab

:: SCREENSHOTS

:: REQUIREMENTS

  • Windows / Mac Os / Linux
  • Perl
  • TK

:: DOWNLOAD

REDUCK for WinSource Code

:: MORE INFORMATION

The software is copyrighted under the terms of the GNU General Public License. You can view this license at http://www.gnu.org/licenses/gpl.txt.

NACK 1.2 – Name Averaging

NACK 1.2

:: DESCRIPTION

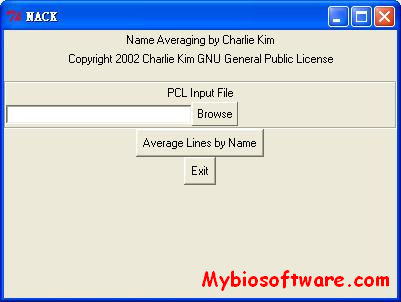
NACK averages data values for a PCL file, but only if the Name (second) column is identical. Intended for averaging data values when multiple spots are present on a single array for a given gene.

::DEVELOPER

Falkow Lab

:: SCREENSHOTS

:: REQUIREMENTS

  • Windows / Mac Os / Linux
  • Perl
  • TK

:: DOWNLOAD

NACK for WinSource Code

:: MORE INFORMATION

The software is copyrighted under the terms of the GNU General Public License. You can view this license at http://www.gnu.org/licenses/gpl.txt.

LACK 4.3 – Lexical Analysis

LACK 4.3

:: DESCRIPTION

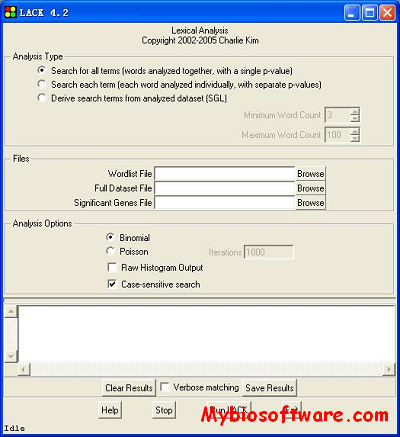
LACK addresses whether or not a theme is actually overrepresented in your significant genes list. The program takes a list of significant genes and a list of user-specified search terms, and counts the number of genes which contain one of the search terms. Then, the program takes a random set of genes of the same size as the significant set from a genome annotation file and counts the hits. This process is repeated a user-specified number of times so that statistics regarding the randomness of the frequencies can be calculated. Statistics and histogram data is output to a text file.

::DEVELOPER

Falkow Lab

:: SCREENSHOTS

:: REQUIREMENTS

  • Windows / Mac Os / Linux
  • Perl
  • TK

:: DOWNLOAD

LACK for WinSource Code ; Manual ; Sample files (zipped)

:: MORE INFORMATION

The software is copyrighted under the terms of the GNU General Public License. You can view this license at http://www.gnu.org/licenses/gpl.txt.

If you use LACK, please cite:
Kim CC, Falkow S.
Significance analysis of lexical bias in microarray data.
BMC Bioinformatics. 2003 Apr 3;4(1):12.

HIMACK 1.4 – Histogram Maker

HIMACK 1.4

:: DESCRIPTION

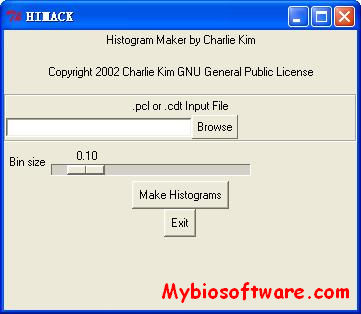
HIMACK takes an input PCL or CDT file and generates a graphical histogram file in JPEG format. Allows rapid stimultaneous viewing of histograms for multiple datasets for quality assessment. Primarily intended for DNA and RNA hybridizations.

::DEVELOPER

Falkow Lab

:: SCREENSHOTS

:: REQUIREMENTS

  • Windows / Mac Os / Linux
  • Perl
  • TK

:: DOWNLOAD

HIMACK for WinSource Code

:: MORE INFORMATION

The software is copyrighted under the terms of the GNU General Public License. You can view this license at http://www.gnu.org/licenses/gpl.txt.

GODACK 1.0 – Good Data

GODACK 1.0

:: DESCRIPTION

GODACK is a simple filtering tool which demands that a certain percentage of datapoints be present in a PCL file. Spots which fail to contain the user-specified percentage of good data points are removed from the dataset.

::DEVELOPER

Falkow Lab

:: SCREENSHOTS

:: REQUIREMENTS

  • Windows / Mac Os / Linux
  • Perl
  • TK

:: DOWNLOAD

GODACK for WinSource Code

:: MORE INFORMATION

The software is copyrighted under the terms of the GNU General Public License. You can view this license at http://www.gnu.org/licenses/gpl.txt.