ENIGMA 1.1 – Extract Gene Expression Modules from Perturbational Microarray Data

ENIGMA 1.1

:: DESCRIPTION

ENIGMA – Expression Network Inference and Global Module Analysis. It is a software tool to analyze the modular structure of perturbational gene expression data, based on the use of combinatorial statistics and graph-based clustering. The modules are further characterized by incorporating other data types, e.g. GO annotation, protein interactions and transcription factor binding information, and by suggesting regulators that might have an effect on the expression of (some of) the genes in the module.

::DEVELOPER

VIB (Flanders Interuniversitary Institute for Biotechnology)
Bioinformatics and Evolutionary Genomics Research Group at Ghent University

:: SCREENSHOTS

Command Line Tool

:: REQUIREMENTS

:: DOWNLOAD

ENIGMA

:: MORE INFORMATION

If you use ENIGMA in your research, please cite:

Steven Maere, Patrick Van Dijck, Martin Kuiper (2008) Extracting expression modules from perturbational gene expression compendia. BMC Systems Biology 2:33 (PubMed,  BMC)

GenePublisher 1.03 – Analysis of DNA Microarray Data

GenePublisher 1.03

:: DESCRIPTION

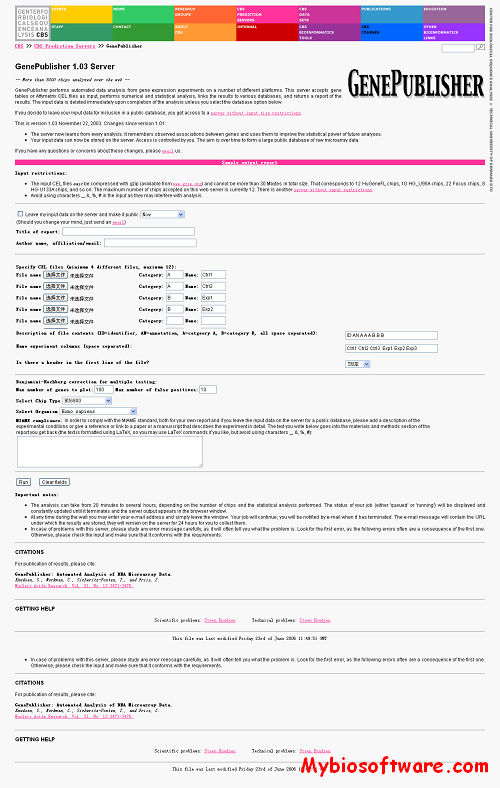
GenePublisher performs automated data analysis from gene expression experiments on a number of different platforms. This server accepts gene tables or Affymetrix CEL files as input, performs numerical and statistical analysis, links the results to various databases, and returns a report of the results. The input data is deleted immediately upon completion of the analysis unless you select the database option below.

::DEVELOPER

CBS (Center for Biological Sequence Analysis) at Technical University of Denmark

:: SCREENSHOTS

:: REQUIREMENTS

  • web browser

:: MORE INFORMATION

Input restrictions:

  • The input CEL files must be compressed with gzip (available from www.gzip.org) and cannot be more than 30 Mbytes in total size. That corresponds to 12 HuGeneFL chips, 10 HG_U95A chips, 22 Focus chips, 8 HG-U133A chips, and so on. The maximum number of chips accepted on this web server is currently 12. There is another server without input restrictions.
  • Avoid using characters _, &, %, # in the input as they may interfere with analysis.

For publication of results, please cite:

GenePublisher: Automated Analysis of DNA Microarray Data.
Knudsen, S., Workman, C., Sicheritz-Ponten, T., and Friis, C.
Nucleic Acids Research. Vol. 31, No. 13 3471-3476.

Mage 6.47 – Kinemage File 3D Display

Mage 6.47

:: DESCRIPTION

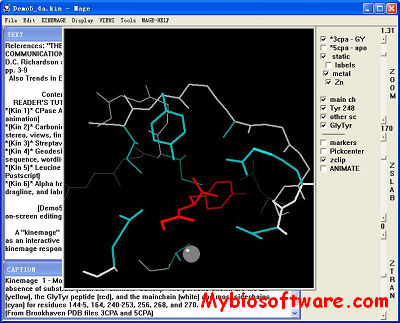
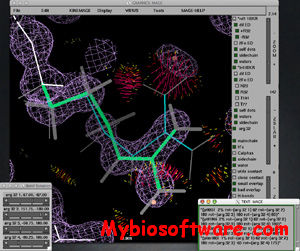
Mage is a 3D vector display program which shows “kinemage” graphics. Used in both teaching and research, in applications ranging from estuary ecology to X-ray crystallography model quality assessments, Mage displays the 3D relationships between data in an interactive environment which facilitates both open-ended exploration and structured presentation. It includes many tools for on-screen measurement, construction, and editing of the display objects; it can write either kinemage output or various types of 2D image output.

::DEVELOPER

Richardson Lab

:: SCREENSHOTS

:: REQUIREMENTS

  • Windows / Mac /  Linux / Silicon Graphics

:: DOWNLOAD

  Mage

:: MORE INFORMATION

Mage is free software available under the terms of its own BSD-style license.

Array Tools 3.3 – Dictyostelium Discoideum Microarray Data Analysis

Array Tools 3.3

:: DESCRIPTION

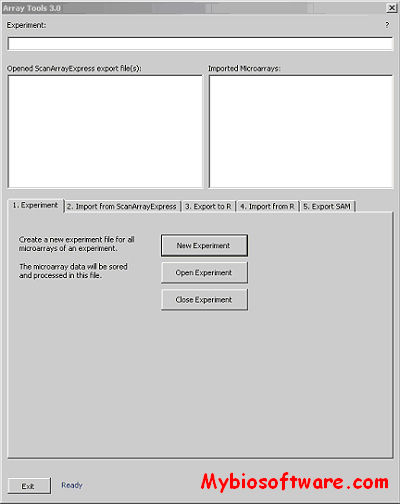
Array Tools is a Microsoft Excel Add-In, which is designed to handle the import and export of Dictyostelium discoideum microarray data. It can be used to:

  • Import ScanArray Express CSV to Excel.
  • Export the data to R by creating Data.spot, R Commands. R and Arrays.txt files.
  • Re-importing data from R to Excel.
  • Exporting data to SAM

::DEVELOPER

Ludwig Eichinger

:: SCREENSHOTS

:: REQUIREMENTS

:: DOWNLOAD

Array Tools

:: MORE INFORMATION

Contact:
Ludwig Eichinger
Institut für Biochemie Köln, Zentrum Biochemie
University of Cologne
http://www.uni-koeln.de/med-fak/biochemie/transcriptomics/

MAGIC Tool 2.1 – MicroArray Genome Imaging & Clustering Tool

MAGIC Tool 2.1

:: DESCRIPTION

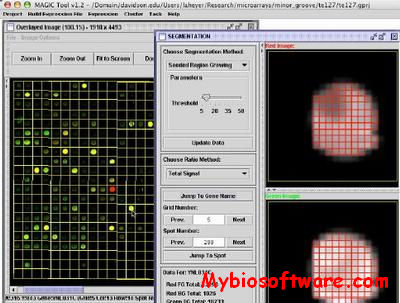
MAGIC Tool is an integrated microarray data analysis software.

The purpose of MAGIC Tool is to allow the user to begin with DNA microarray tiff files and end with biologically meaningful information. Comparative hybridization data (glass chips) and Affymetrix data are compatible with MAGIC Tool. You can start with tiff files or expression files.

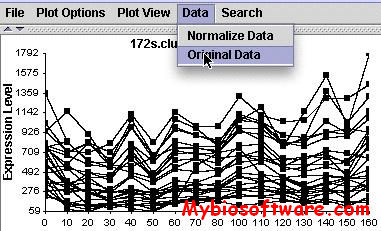
MAGIC Tool allows the user to change parameters for clustering, data quantification etc.

::DEVELOPER

Laurie Heyer

:: SCREENSHOTS

:: REQUIREMENTS

  • Windows/Mac/ Linux/ UNIX
  • Java

:: DOWNLOAD

MAGIC Tool ;  User’s Guide

:: MORE INFORMATION

Free software with open source.

Paper: MAGIC Tool: Integrated microarray data analysis (Bioinformatics, 2005)

Venn Mapper 1.01 – Compare Heterologous Microarray Data Sets

Venn Mapper 1.01

:: DESCRIPTION

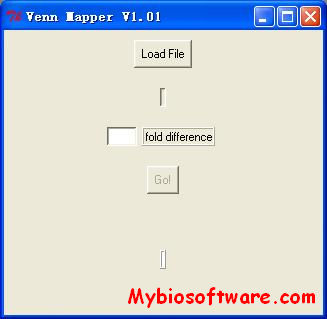
Venn Mapper is a program that cluster heterologous microarray data based on the number of co-occurring differentially expressed genes. The application loads microarray data (gene expression ratios) and determines which genes are up- or down-regulated by a user-defined ratio cut-off level. For each experiment, lists of differentially expressed genes are computed. Every list will be compared to every other list, and the number of co-occurring genes will be calculated. With the use of the binomial distribution, so called z-values can be assigned to the overlap found between two lists. The z-values can be directly imported into the Cluster and/or TreeView software.

::DEVELOPER

Marcel Smid

:: SCREENSHOTS

:: REQUIREMENTS

  • Windows/ Other OS with Perl

:: DOWNLOAD

Venn Mapper for Win ; Perl Resource Code

:: MORE INFORMATION

Citation:

M. Smid ,L.C.J. Dorssers, G. Jenster, Venn Mapping: clustering of heterologous microarray data based on the number of co-occurring differentially expressed genes, Bioinformatics (2003) 19 (16): 2065-2071.

ArrayMiner 5.3 – Microarray Gene Expression Data Analysis

ArrayMiner 5.3

:: DESCRIPTION

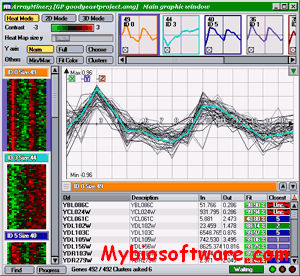
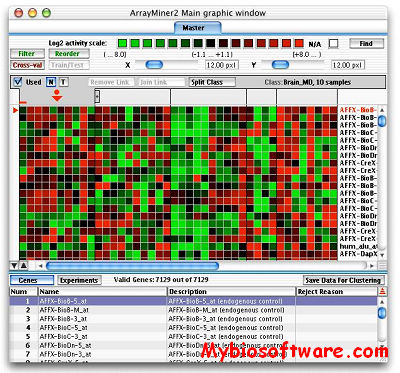
ArrayMiner® is a set of analysis tools using advanced algorithms to reveal the true structure of your gene expression data. Its unique graphical interface gives you an intimate understanding of the analysis and an easy publishing of its results.

ArrayMiner include clustering module & classmarking module.

::DEVELOPER

Optimal Design

:: SCREENSHOTS

:: REQUIREMENTS

  • Windows / Mac OsX

:: DOWNLOAD

ArrayMiner Demo / Free Lite

:: MORE INFORMATION

In order to be eligible for the free light version, your institution must be academic. The light version is limited to 500 genes and 10 experiments for the clustering module and 500 genes for the ClassMarker tool. The light licence’s validity is 1 year.

Price List.

PovChem 2.1.1 – Chemical Visualization & Illustration & POV File Converter

PovChem 2.1.1

:: DESCRIPTION

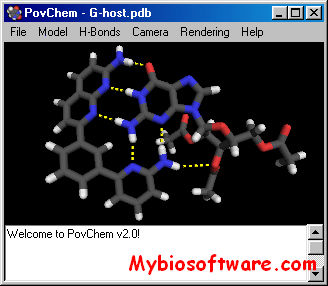
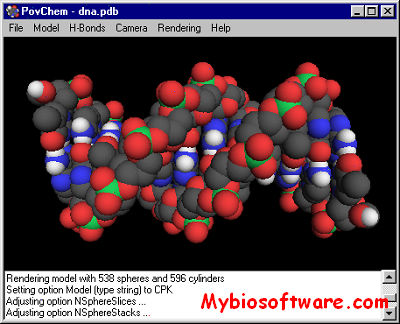
PovChem is a chemical visualization and illustration program with a new graphic interface. It takes molecules in the PDB format, lets you to set up a picture with fine control over details of the illustration – colors, atom and bond radii, view orientation, etc. It will even calculate and display hydrogen bonds.

PovChem can export the picture in POV-Ray format, which allows you to render the image with a state-of-the-art raytracer, giving high-quality images at any resolution, for anything from web page thumbnails to full-size high-resolution images for journal covers, advertisements, posters, anything!

::DEVELOPER

Paul A. Thiessen

:: SCREENSHOTS

:: REQUIREMENTS

:: DOWNLOAD

PovChem

:: MORE INFORMATION

PovChem is now free!Use this key to register your copy of PovChem:
APyUrblJnYZr

Motif Search 0.2

Motif Search 0.2

:: DESCRIPTION

A simple motif searcher. No matrices, nothing fancy, just simple searching for base strings. Allows degenerate bases to be used.

::DEVELOPER

Falkow Lab

:: SCREENSHOTS

:: REQUIREMENTS

:: DOWNLOAD

Motif Search ; Source Code

:: MORE INFORMATION

The software is copyrighted under the terms of the GNU General Public License. You can view this license at http://www.gnu.org/licenses/gpl.txt.

LOCK 1.2 – Locater of Oligos

LOCK 1.2

:: DESCRIPTION

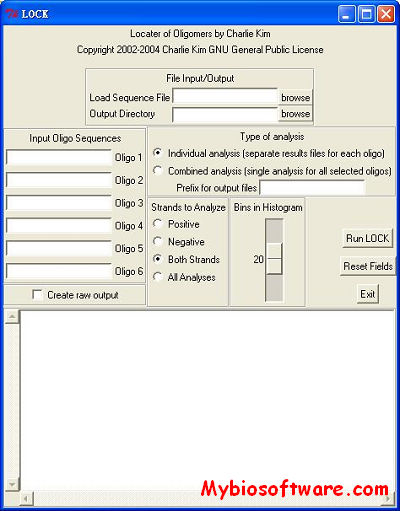
LOCK Locates user-specified oligonucleotide patterns within a larger sequence. For example, restriction digest sites and fragment sizes can be determined for a plasmid or genome.

::DEVELOPER

Falkow Lab

:: SCREENSHOTS

:: REQUIREMENTS

  • Windows / Mac Os / Linux
  • Perl
  • TK

:: DOWNLOAD

LOCK ; Source Code

:: MORE INFORMATION

The software is copyrighted under the terms of the GNU General Public License. You can view this license at http://www.gnu.org/licenses/gpl.txt.