PhyloGrapher 20030403 – Graph Drawing of Biological Data

PhyloGrapher 20030403

:: DESCRIPTION

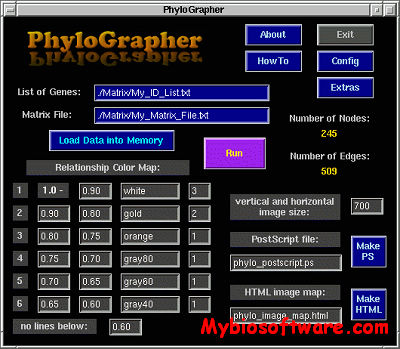
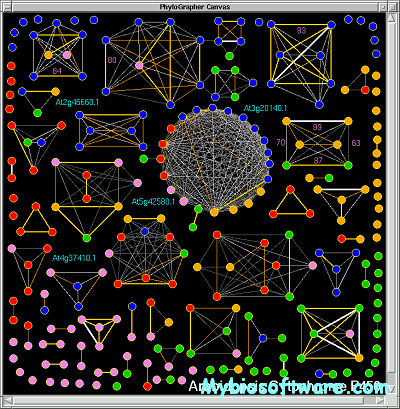
PhyloGrapher is a program designed to visualize and study evolutionary relationships within families of homologous genes or proteins (elements). PhyloGrapher is a drawing tool that generates custom graphs for a given set of elements. In general, it is possible to use PhyloGrapher to visualize any type of relations between elements.

::DEVELOPER

Alexander Kozik

:: SCREENSHOTS

:: REQUIREMENTS

  • Windows / Linux / Mac OsX
  • Tcl/Tk

:: DOWNLOAD

PhyloGrapher

:: MORE INFORMATION

WinIAP – Ion Activities and Calcite Saturation Index

WinIAP

:: DESCRIPTION

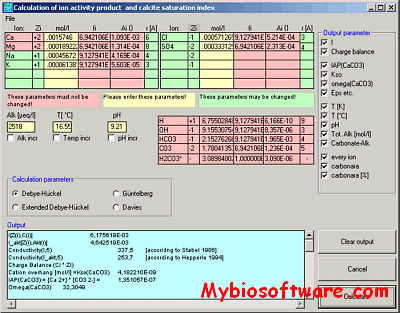
WinIAP calculates the ion activity products and the calcite saturation index for a given set of ions in a solution.

::DEVELOPER

SequentiX

:: SCREENSHOTS

:: REQUIREMENTS

  • Windows

:: DOWNLOAD

WinIAP

:: MORE INFORMATION

This software is free for private and scientific purposes!

Chemulator – Converter for Chemical Concentrations

Chemulator

:: DESCRIPTION

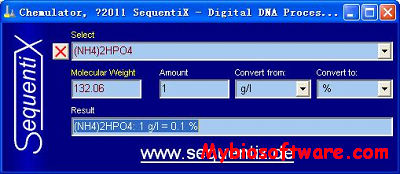
Chemulator converts concentration units (e.g. mg/l) into other concentration units (e.g. into molar concentrations).

::DEVELOPER

SequentiX

:: SCREENSHOTS

:: REQUIREMENTS

  • Windows

:: DOWNLOAD

Chemulator

:: MORE INFORMATION

This software is free for private and scientific purposes!

Stat-200 2.1 – General Statistics and Graphics Package

Stat-200 2.1

:: DESCRIPTION

Stat-200 is a remarkably comprehensive general statistics package. It incorporates all the descriptive statistics, parametric and non-parametric statistical tests, graphics and data transforms you will need for processing, analyzing and presenting data. Parametric tests and procedures in Stat-200 total 60 and there are 66 non-parametric tests and procedures and 30 different descriptive statistics. ANOVA is comprehensive and includes general N factor analysis. Many unusual procedures are included e.g. survival analysis. All tests have associated information windows which give literature references and other facts to assist in getting the right one for the job. Probabilities are calculated directly so there is no need to use tables

::DEVELOPER

Biosoft

:: SCREENSHOTS

:: REQUIREMENTS

  • Windows

:: DOWNLOAD

Stat-200

:: MORE INFORMATION

Ordering


FigSys 2.4 – Publication Quality Graph Plotting and Data Analysis

FigSys 2.4

:: DESCRIPTION

FigSys is a program for processing, analyzing and presenting data and creating science documents of all kinds. FigSys is a major advance in Windows graphics software. It is powerful but easily accessible to users of all levels of experience. Turning your data into basic figure types such as line graphs, bar charts, areagrams, drop-plots or scatter diagrams is completely automatic and there are endless refinements which can be added with the simple-to-use tools. Text-only charts can be created and 3D data graphing is also included.

::DEVELOPER

Biosoft

:: SCREENSHOTS

:: REQUIREMENTS

  • Windows

:: DOWNLOAD

FigSys

:: MORE INFORMATION

Ordering


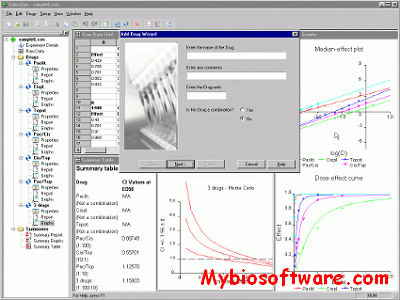
CalcuSyn 2 – Dose-effect analysis

CalcuSyn 2

:: DESCRIPTION

CalcuSyn is the definitive analyzer of combined drug effects, able automatically to quantify phenomena such as synergism and inhibition. Mixed drug treatment is becoming common in the treatment of cancer, AIDS etc, and CalcuSyn is the most widely used software for establishing efficacy in this field. It performs multiple drug dose-effect calculations using the Median Effect methods described by T-C Chou and P. Talalay (Trends Pharmacol. Sci. 4, 450-454).

::DEVELOPER

Biosoft

:: SCREENSHOTS

:: REQUIREMENTS

  • Windows

:: DOWNLOAD

CalcuSyn

:: MORE INFORMATION

Ordering


AssayZap 3.0 – System for Analyzing RIAs, ELISAs, IRMAs and other Assays

AssayZap 3.0

:: DESCRIPTION

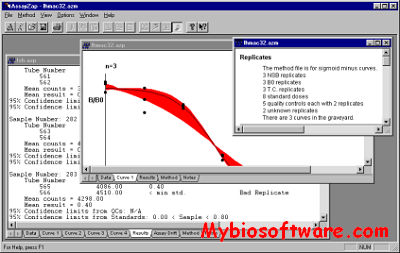
AssayZap is a universal assay calculator for RIA, ELISA, IRMA, colorimetric or any other type of assay. Counts of up to 2^31 can be handled. Standard curves can be fitted by 2-parameter, 4-parameter or 4-parameter weighted fit, or by the unique interactive manual fit which permits all standard curves to be fitted, whatever their shape. Assays may include up to 2000 tubes and up to four standard curves, each of which can incorporate up to 24 values. Assay drift can be compensated by interpolation of results between standard curves.

::DEVELOPER

Biosoft

:: SCREENSHOTS

:: REQUIREMENTS

  • Windows

:: DOWNLOAD

AssayZap

:: MORE INFORMATION

Ordering


DoubleTree 0.7 – Compare Two Trees using Coupled Interaction

DoubleTree 0.7

:: DESCRIPTION

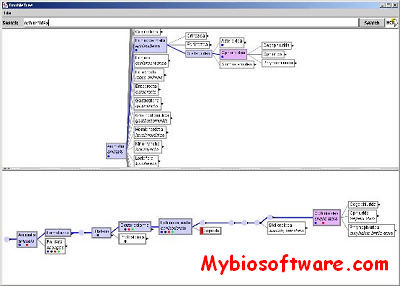
DoubleTree is an an application for comparing two trees using coupled interaction. DoubleTree is built on TaxonTree.

::DEVELOPER

Biodiversity Informatics Visualization TeamHuman-Computer Interaction Lab , University of Maryland

:: SCREENSHOTS

:: REQUIREMENTS

  • Windows

:: DOWNLOAD

DoubleTree

:: MORE INFORMATION

TaxonTree 1.2 – Interactive Tree Visualization for Kingdom Animalia

TaxonTree 1.2

:: DESCRIPTION

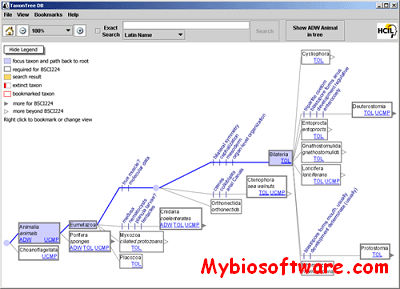
TaxonTree combines dynamic query interfaces and zoomable graphics to visually accommodate highly interconnected data such as the Linnaean hierarchy for Kingdom Animalia . Because the structure of the data is visualized, the interface should be suitable both for biologists and for the general public. Names of organisms are essential to any biological database, including genomic databases, so a tool that allows effective searching and browsing of these names has wide application.

::DEVELOPER

Biodiversity Informatics Visualization TeamHuman-Computer Interaction Lab , University of Maryland

:: SCREENSHOTS

:: REQUIREMENTS

  • Windows

:: DOWNLOAD

TaxonTree

:: MORE INFORMATION

Citation:

Lee, B., C.S. Parr, D. Campbell, and B. Bederson. 2004.
How Users Interact with Biodiversity Information Using TaxonTree.
Proceedings of Advanced Visual Interfaces (AVI 2004) pp. 320-327.

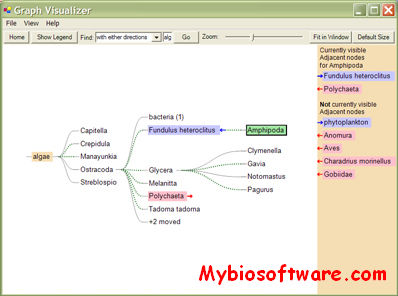
TreePlus 20060630 – Explore Large, Complex Food Webs

TreePlus 20060630

:: DESCRIPTION

TreePlus is a visualizer to enable exploration of large, complex food webs. Ultimately, this system, embedded in ecoLens, will allow biologists to test approaches to modelling interactions among organisms.

::DEVELOPER

Biodiversity Informatics Visualization TeamHuman-Computer Interaction Lab , University of Maryland

:: SCREENSHOTS

:: REQUIREMENTS

  • Windows

:: DOWNLOAD

TreePlus

:: MORE INFORMATION

Citation:

B. Lee, C.S. Parr, C. Plaisant, B.B. Bederson, V.D. Veksler, W.D. Gray, and C. Kotfila (2006)
TreePlus: Interactive Exploration of Networks with Enhanced Tree Layouts,
IEEE TVCG Special Issue on Visual Analytics, vol. 12, no. 6, pp. 1414-1426.