BioVenn 1.1.3 / DeepVenn – Comparison and Visualization of Biological lists using Area-proportional Venn diagrams

BioVenn 1.1.3 / DeepVenn

:: DESCRIPTION

BioVenn is an easy-to-use web application to generate area-proportional Venn diagrams from lists of biological identifiers. It supports a wide range of identifiers from the most used biological databases currently available.

DeepVenn – Create Area-Proportional Venn Diagrams Using Deep Learning

::DEVELOPER

Tim Hulsen

:: SCREENSHOTS

N/A

:: REQUIREMENTS

  • Web browser / Linux
  • R / Python

:: DOWNLOAD

BioVenn ,  Python package

:: MORE INFORMATION

Citation:

BMC Genomics. 2008 Oct 16;9:488. doi: 10.1186/1471-2164-9-488.
BioVenn – a web application for the comparison and visualization of biological lists using area-proportional Venn diagrams.
Hulsen T1, de Vlieg J, Alkema W.

ReadXplorer 2.2.3 – Visualization and Analysis of Mapped Sequences

ReadXplorer 2.2.3

:: DESCRIPTION

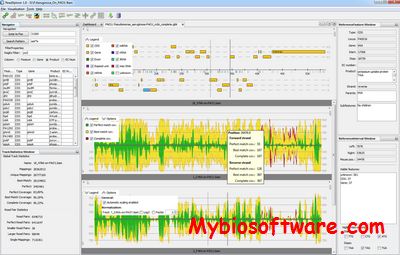
ReadXplorer is a freely available comprehensive exploration and evaluation tool for NGS data. It extracts and adds quantity and quality measures to each alignment in order to classify the mapped reads. This classification is then taken into account for the different data views and all supported automatic analysis functions.

::DEVELOPER

Bioinformatics and Systems Biology, Justus-Liebig-University

:: SCREENSHOTS

ReadXplorer

:: REQUIREMENTS

  • Linux / Windows / MacOsX
  • Java

:: DOWNLOAD

 ReadXplorer

:: MORE INFORMATION

Citation

Hilker R, Stadermann KB, Schwengers O, Anisiforov E, Jaenicke S, Weisshaar B, Zimmermann T, Goesmann A.
ReadXplorer 2-detailed read mapping analysis and visualization from one single source.
Bioinformatics. 2016 Dec 15;32(24):3702-3708. doi: 10.1093/bioinformatics/btw541. Epub 2016 Aug 18. PMID: 27540267; PMCID: PMC5167064.

Bioinformatics. 2014 Apr 30. [Epub ahead of print]
ReadXplorer – Visualization and Analysis of Mapped Sequences.
Hilker R, Stadermann KB, Doppmeier D, Kalinowski J, Stoye J, Straube J, Winnebald J, Goesmann A.

CRCView 20070312 – Web-based Microarray data analysis and Visualization system

CRCView 20070312

:: DESCRIPTION

CRCView is a web-based microarray data analysis and visualization system. CRCView is powered by CRC, or Chinese Restaurant cluster, a Dirichlet process model-based clustering algorithm

::DEVELOPER

He Group 

:: SCREENSHOTS

N/A

:: REQUIREMENTS

  • Web Browser

:: DOWNLOAD

 NO

:: MORE INFORMATION

Citation

Bioinformatics. 2007 Jul 15;23(14):1843-5. Epub 2007 May 7.
CRCView: a web server for analyzing and visualizing microarray gene expression data using model-based clustering.
Xiang Z1, Qin ZS, He Y.

SNP-VISTA 1.0 – SNP Visualization tool

SNP-VISTA 1.0

:: DESCRIPTION

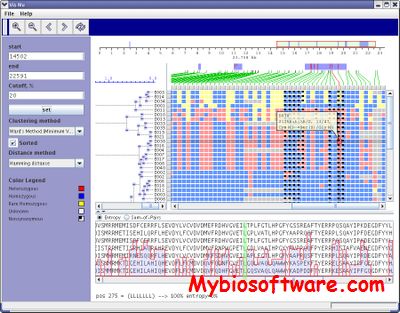
SNP-VISTA is an interactive SNP visualization tool.

GeneSNP-VISTA: Visualization of mutations in genes

EcoSNP-VISTA – Visualization of SNPs and discovery of recombination points in microbial populations

::DEVELOPER

Inna Dubchak at U.S. Department of Energy Joint Genome Institute

:: SCREENSHOTS

SNP-VISTA

:: REQUIREMENTS

  • Linux/ WIndows/MacOsX
  • Java

:: DOWNLOAD

 GeneSNP-VISTA , EcoSNP-VISTA

:: MORE INFORMATION

Citation

Shah N, Teplitsky MV, Minovitsky S, Pennacchio LA, Hugenholtz P, Hamann B, Dubchak I
SNP-VISTA: An interactive SNP visualization tool,
BMC Bioinformatics 2005, 6:292

ClineHelpR v1.1 – Genomic Cline Outlier Detection and Visualization

ClineHelpR v1.1

:: DESCRIPTION

ClineHelpR is an R-package for visualizing genomic clines and detecting outlier loci using output generated by two popular software packages, bgc and Introgress

::DEVELOPER

Bradley Martin

:: SCREENSHOTS

N/A

:: REQUIREMENTS

  • Windows/ Linux / MacOsX
  • R

:: DOWNLOAD

ClineHelpR

:: MORE INFORMATION

Citation

Martin BT, Chafin TK, Douglas MR, Douglas ME.
ClineHelpR: an R package for genomic cline outlier detection and visualization.
BMC Bioinformatics. 2021 Oct 16;22(1):501. doi: 10.1186/s12859-021-04423-x. PMID: 34656096; PMCID: PMC8520269.

Ceiba 1.05 – Scalable Phylogeny Visualization with Images

Ceiba 1.05

:: DESCRIPTION

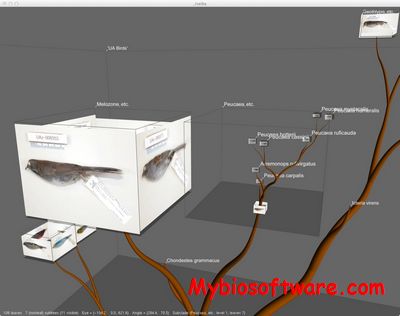
Ceiba is a program for visualization and navigation of large phylogenetic trees, and annotation of these trees with collections of images.

::DEVELOPER

Mike Sanderson

:: SCREENSHOTS

Ceiba

:: REQUIREMENTS

  • Linux/MacOsX

:: DOWNLOAD

 Ceiba

:: MORE INFORMATION

Citation

Bioinformatics. 2014 May 9. [Epub ahead of print]
Ceiba: scalable visualization of phylogenies and 2D/3D image collections.
Sanderson MJ.

CoolBox 0.3.8 – Jupyter Notebook based Genomic data Visualization toolkit

CoolBox 0.3.8

:: DESCRIPTION

CoolBox is an open-source toolkit for visual analysis of genomics data.

:: DEVELOPER

GangCaoLab

:: SCREENSHOTS

N/A

:: REQUIREMENTS

  • Linux / Window
  • Python

:: DOWNLOAD

CoolBox

:: MORE INFORMATION

Citation

Xu W, Zhong Q, Lin D, Zuo Y, Dai J, Li G, Cao G.
CoolBox: a flexible toolkit for visual analysis of genomics data.
BMC Bioinformatics. 2021 Oct 10;22(1):489. doi: 10.1186/s12859-021-04408-w. PMID: 34629071.

MetaViz – Visualization software for Metabolic Network

MetaViz

:: DESCRIPTION

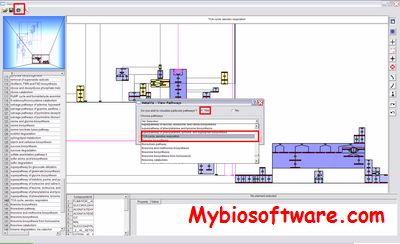
MetaViz enables to draw a genome-scale metabolic network and that also takes into account its structuration into pathways.

::DEVELOPER

Romain Bourqui

:: SCREENSHOTS

:: REQUIREMENTS

:: DOWNLOAD

 MetaViz

:: MORE INFORMATION

Citation

Romain Bourqui , Ludovic Cottret , Vincent Lacroix , David Auber , Patrick Mary , Marie-France Sagot and Fabien Jourdan
Metabolic network visualization eliminating node redundance and preserving metabolic pathways
BMC Systems Biology 2007, 1:29doi:10.1186/1752-0509-1-29

GEMSiRV 20130911 – GEnome-scale Metabolic Model Simulation, Reconstruction and Visualization

GEMSiRV 20130911

:: DESCRIPTION

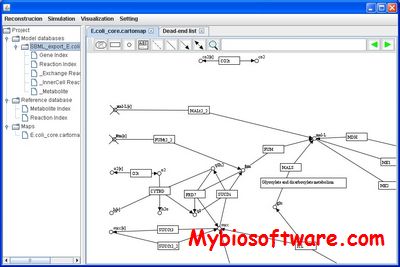
GEMSiRV is a software platform to provide functionalities of easy metabolic network drafting and editing, amenable network visualization for experimental data integration and flux balance analysis tools for simulation studies.

::DEVELOPER

GEMSiRV team

:: SCREENSHOTS

GEMSiRV

:: REQUIREMENTS

  • Linux/ Windows/ MacOsX
  • Java

:: DOWNLOAD

 GEMSiRV

:: MORE INFORMATION

Citation

Bioinformatics. 2012 Jul 1;28(13):1752-8. doi: 10.1093/bioinformatics/bts267. Epub 2012 May 4.
GEMSiRV: a software platform for GEnome-scale metabolic model simulation, reconstruction and visualization.
Liao YC1, Tsai MH, Chen FC, Hsiung CA.

DomainGraph 3.01 – Cytoscape Plugin of Analysis and Visualization of Molecular Interaction Networks

DomainGraph 3.01

:: DESCRIPTION

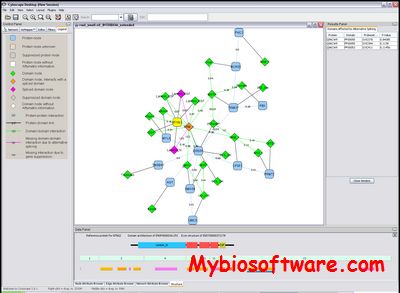
DomainGraph is the successor tool of DomainNetworkBuilder and works as Java plugin for Cytoscape, a free open-source software platform for visualization and analysis of biomolecular networks. This plugin decomposes protein networks into domain-domain interactions and generates a new network of interacting domains. It also allows the integration of exon expression data measured using Affymetrix GeneChip microarrays, which supports the analysis of alternative splicing events and the characterization of their effects on protein and domain interaction networks.

::DEVELOPER

Max-Planck-Institut Informatik

:: SCREENSHOTS

:: REQUIREMENTS

:: DOWNLOAD

  DomainGraph

:: MORE INFORMATION

Citation:

Emig, D., Salomonis, N., Baumbach, J., Lengauer, T., Conklin, BR., Albrecht, M. (2010)
AltAnalyze and DomainGraph: analyzing and visualizing exon expression data.
Nucleic Acids Res. 2010 July 1; 38