GIPro 1.0 – Visualization of High-throughput Genetic and Physical Interaction data

GIPro 1.0

:: DESCRIPTION

GIPro is a Cytoscape plugin developed to allow integrative analysis and visualization of high-throughput genetic and physical interaction data in the context of protein complexes.

::DEVELOPER

The Wodak Lab

:: SCREENSHOTS

:: REQUIREMENTS

:: DOWNLOAD

 GIPro

:: MORE INFORMATION

MSAVis – Multiple Sequence Alignment Visualization system

MSAVis

:: DESCRIPTION

MSAVis is a multiple sequence alignment visualization system that integrates the display of conserved domain data.

:: DEVELOPER

AgBase

:: SCREENSHOTS

MSAVis

:: REQUIREMENTS

  • Windows /Linux/MacOsX
  • Python
  • BioPython
  • wxPython
  • NumPy
  • PyOpenGL

:: DOWNLOAD

 MSAVis

:: MORE INFORMATION

Citation

BMC Bioinformatics. 2009 Oct 8;10 Suppl 11:S7. doi: 10.1186/1471-2105-10-S11-S7.
Exploratory visual analysis of conserved domains on multiple sequence alignments.
Jankun-Kelly TJ, Lindeman AD, Bridges SM.

PACVr 0.9.4 – Plastome Assembly Coverage Visualization in R

PACVr 0.9.4

:: DESCRIPTION

PACVr visualizes the coverage depth of a complete plastid genome as well as the equality of its inverted repeat regions in relation to the circular, quadripartite genome structure and the location of individual genes.

::DEVELOPER

Michael Gruenstaeudl

:: SCREENSHOTS

N/A

:: REQUIREMENTS

  • Windows/ Linux / MacOs
  • R

:: DOWNLOAD

PACVr

:: MORE INFORMATION

Citation

Gruenstaeudl M, Jenke N.
PACVr: plastome assembly coverage visualization in R.
BMC Bioinformatics. 2020 May 24;21(1):207. doi: 10.1186/s12859-020-3475-0. PMID: 32448146; PMCID: PMC7245912.

MarVis Suite 2.0 – Clustering & Visualization of Metabolomic Markers

MarVis Suite 2.0

:: DESCRIPTION

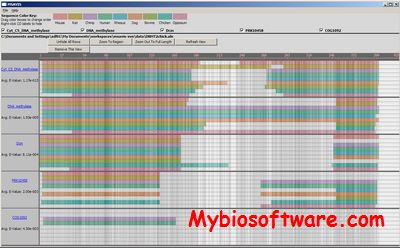
MarVis (Marker Visualization) is designed for intensity-based clustering and visualization of large sets of metabolomic markers.The application of 1D-SOMs gives a convenient overview on relevant profiles and groups of profiles. The specialized visualization effectively supports researchers in analyzing a large number of putative clusters, even though the true number of biologically meaningful groups is unknown. Although MarVis has been developed for the analysis of metabolomic data, the tool may be applied to gene expression data as well.

::DEVELOPER

Department of Bioinformatics ,  University of Göttingen

:: SCREENSHOTS

:: REQUIREMENTS

  • Linux / Windows

:: DOWNLOAD

MarVis

:: MORE INFORMATION

Citation

Kaever A, Lingner T, Feussner K, G?bel C, Feussner I, Meinicke P:
MarVis: a tool for clustering and visualization of metabolic biomarkers.
BMC Bioinformatics 2009, 10:92.

miRseqViewer 1.0 – Visualization of Sequence, Structure and Expression for Analysis of microRNA Sequencing data

miRseqViewer 1.0

:: DESCRIPTION

miRseqViewer is a highly interactive application that visualizes the sequence alignment, secondary structure and normalized read counts in synchronous multi-panel windows.

::DEVELOPER

miRseqViewer team

:: SCREENSHOTS

miRseqViewer

:: REQUIREMENTS

  • Linux / MacOsX/ Windows
  • Java

:: DOWNLOAD

 miRseqViewer

:: MORE INFORMATION

Citation

miRseqViewer: Multi-panel visualization of sequence, structure and expression for analysis of microRNA sequencing data.
Jang I, Chang H, Jun Y, Park S, Yang JO, Lee B, Kim W, Kim VN, Lee S.
Bioinformatics. 2014 Oct 15. pii: btu676.

RINalyzer 2.0 – Cytoscape plugin of Visualization and Analysis of Biomolecular Networks

RINalyzer 2.0

:: DESCRIPTION

RINalyzer is a Java plugin for Cytoscape, a free open-source software platform for visualization and analysis of biomolecular networks. This plugin allows the simultaneous visualization and interactive analysis of residue interaction networks (RINs) together with the corresponding 3D protein structures displayed in UCSF Chimera. It also provides a comprehensive set of topological centrality measures to gain additional insights into the structural and functional role of interacting residues.

::DEVELOPER

RINalyzer team

:: SCREENSHOTS

:: REQUIREMENTS

:: DOWNLOAD

 RINalyzer

:: MORE INFORMATION

Citation:

Doncheva, N.T., Klein, K., Domingues, F.S., Albrecht, M. (2011):
Analyzing and visualizing residue networks of protein structures.
Trends in Biochemical Sciences, 36(4): 179-182.

LocusZoom 1.3 – Visualization of Genome-wide Association Scan Result

LocusZoom 1.3

:: DESCRIPTION

LocusZoom is a tool to plot regional association results from genome-wide association scans or candidate gene studies.Users may generate a single plot using a web form, or many plots using batch mode. The software utilizes LD information from HapMap Phase II (CEU, YRI and JPT+CHB) or 1000 Genomes (CEU) and gene information from the UCSC browser, and will accept SNP identifiers in dbSNP or 1000 Genomes format.

::DEVELOPER

the Center for Statistical Genetics

:: SCREENSHOTS

N/A

:: REQUIREMENTS

:: DOWNLOAD

 LocusZoom

:: MORE INFORMATION

Citation

Pruim RJ, Welch RP, Sanna S, Teslovich TM, Chines PS, Gliedt TP, Boehnke M, Abecasis GR, Willer CJ.
LocusZoom: regional visualization of genome-wide association scan results
Bioinformatics (2010) 26 (18): 2336-2337.

SPICE 6.1001 – Data Mining & Visualization Software for Multicolor Flow Cytometry

SPICE 6.1001

:: DESCRIPTION

SPICE is a data mining software application that analyzes large FLOWJO data sets from polychromatic flow cytometry and organizes the normalized data graphically. SPICE enables users to discover potential correlations in their experimental data within complex data sets.

::DEVELOPER

Bioinformatics and Computational Biosciences Branch (BCBB),National Institute of Allergy and Infectious Diseases (NIAID)

:: SCREENSHOTS

SPICE

:: REQUIREMENTS

  • Mac OsX

:: DOWNLOAD

 SPICE

:: MORE INFORMATION

Citation

Cytometry A. 2011 Feb;79(2):167-74. doi: 10.1002/cyto.a.21015. Epub 2011 Jan 7.
SPICE: exploration and analysis of post-cytometric complex multivariate datasets.
Roederer M, Nozzi JL, Nason MC.

MorphoGraphX 1.1.1280 – Visualization and Processing of 3D Biological Datasets

MorphoGraphX 1.1.1280

:: DESCRIPTION

MorphoGraphX is a cross-platform, open-source application for the visualization and processing of 3D biological datasets.

::DEVELOPER

Richard S. Smith ,Systems Biology/Developmental Modeling

:: SCREENSHOTS

MorphoGraphX

::REQUIREMENTS

  • Linux

:: DOWNLOAD

 MorphoGraphX

:: MORE INFORMATION

Citation

Methods Mol Biol. 2014;1080:121-34. doi: 10.1007/978-1-62703-643-6_10.
Quantifying cell shape and gene expression in the shoot apical meristem using MorphoGraphX.
de Reuille PB1, Robinson S, Smith RS.

Daniel Kierzkowski et al.
Elastic Domains Regulate Growth and Organogenesis in the Plant Shoot Apical Meristem
Science 2 March 2012: Vol. 335 no. 6072 pp. 1096-1099

ModView 0.903 – Visualization of Multiple Protein Sequences & Structures

ModView 0.903

:: DESCRIPTION

ModView is a program to visualize and analyze multiple biomolecule structures and/or sequence alignments. As a Netscape plug-in , it can be embed into Web pages and controlled by JavaScript objects on the page. It has wide range of tools to manipulate and analyze sequences and structures by interactive control.

::DEVELOPER

Andrej Sali

:: SCREENSHOTS

:: REQUIREMENTS

  • Netscape 4.xx

:: DOWNLOAD

ModView

:: MORE INFORMATION

Citation:

Bioinformatics. 2003 Jan;19(1):165-6.
ModView, visualization of multiple protein sequences and structures.
Ilyin VA, Pieper U, Stuart AC, Marti-Renom MA, McMahan L, Sali A.