MarVis Suite 2.0
:: DESCRIPTION
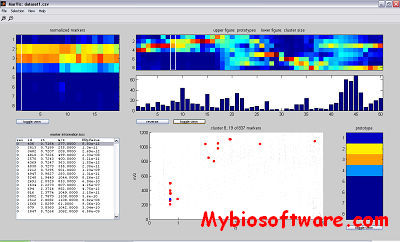
MarVis (Marker Visualization) is designed for intensity-based clustering and visualization of large sets of metabolomic markers.The application of 1D-SOMs gives a convenient overview on relevant profiles and groups of profiles. The specialized visualization effectively supports researchers in analyzing a large number of putative clusters, even though the true number of biologically meaningful groups is unknown. Although MarVis has been developed for the analysis of metabolomic data, the tool may be applied to gene expression data as well.
::DEVELOPER
Department of Bioinformatics , University of Göttingen
:: SCREENSHOTS
:: REQUIREMENTS
- Linux / Windows
:: DOWNLOAD
:: MORE INFORMATION
Citation
Kaever A, Lingner T, Feussner K, G?bel C, Feussner I, Meinicke P:
MarVis: a tool for clustering and visualization of metabolic biomarkers.
BMC Bioinformatics 2009, 10:92.

