BamView 1.2.11 – Display of Read Alignments in BAM Data Files

BamView 1.2.11

:: DESCRIPTION

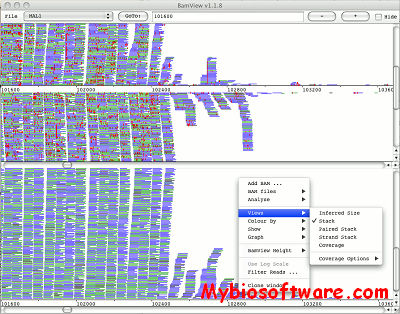
BamView is a free interactive display of read alignments in BAM data files.

::DEVELOPER

the Sanger Institute

:: SCREENSHOTS

:: REQUIREMENTS

  • Windows / MacOsX /  Linux
  • Java

:: DOWNLOAD

BamView

:: MORE INFORMATION

Citation

Brief Bioinform. 2013 Mar;14(2):203-12. doi: 10.1093/bib/bbr073. Epub 2012 Jan 16.
BamView: visualizing and interpretation of next-generation sequencing read alignments.
Carver T1, Harris SR, Otto TD, Berriman M, Parkhill J, McQuillan JA.

Tim Carver; Ulrike Böhme, Thomas D. Otto; Julian Parkhill; Matthew Berriman
BamView: Viewing mapped read alignment data in the context of the reference sequence.
Bioinformatics 2010;
GSDS 2.0 – Gene Structure Display Server

GSDS 2.0

:: DESCRIPTION

GSDS is designed for the visualization of annotated features for genes, and the generation of high-quality figures for publication.

::DEVELOPER

Gao Lab, Peking University.

:: SCREENSHOTS

N/A

::REQUIREMENTS

  • Web Browser

:: DOWNLOAD

 NO

:: MORE INFORMATION

Citation

GSDS 2.0: an upgraded gene feature visualization server.
Hu B, Jin J, Guo AY, Zhang H, Luo J, Gao G.
Bioinformatics. 2014 Dec 10. pii: btu817

PDBjViewer 4.5.5 – Display 3D Molecular Graphics of Proteins and Nucleic Acids

PDBjViewer 4.5.5

:: DESCRIPTION

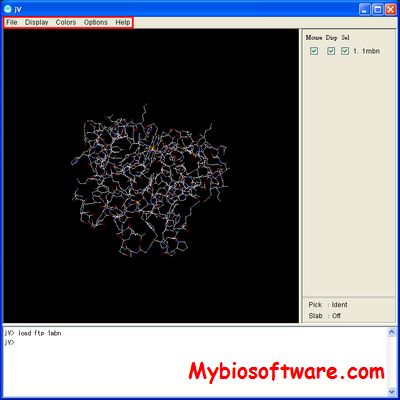
PDBjViewer (jV, for short) is a program to display molecular graphics of proteins and nucleic acids.

::DEVELOPER

PDBjViewer team

:: SCREENSHOTS

:: REQUIREMENTS

  • Linux / MacOsX / Windows
  • Java
  • JOGL

:: DOWNLOAD

 PDBjViewer

:: MORE INFORMATION

Citation

Bioinformatics. 2004 May 22;20(8):1329-30. Epub 2004 Feb 10.
eF-site and PDBjViewer: database and viewer for protein functional sites.
Kinoshita K, Nakamura H.

MapMan 3.6.0RC1 – Displays large datasets onto Diagrams of Metabolic Pathways

MapMan 3.6.0RC1

:: DESCRIPTION

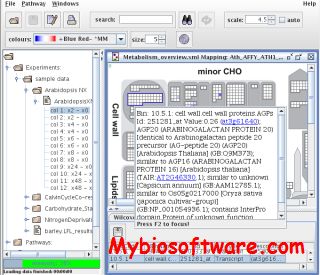
MapMan is a user-driven tool that displays large datasets (e.g. gene expression data from Arabidopsis Affymetrix arrays) onto diagrams of metabolic pathways or other processes.

::DEVELOPER

Max Planck Institute for Molecular Plant Physiology

:: SCREENSHOTS

:: REQUIREMENTS

  • Windows/Linux/MacOsX
  • Java

:: DOWNLOAD

 MapMan

:: MORE INFORMATION

Citation

Thimm O, Blaesing O, Gibon Y, Nagel A, Meyer S, Krüger P, Selbig J, Müller LA, Rhee SY and M Stitt (2004)
MAPMAN: a user-driven tool to display genomics data sets onto diagrams of metabolic pathways and other biological processes.
Plant J. 37(6):914-39.

iTOL 5.2 – Display & Manipulation of Phylogenetic Trees

iTOL 5.2

:: DESCRIPTION

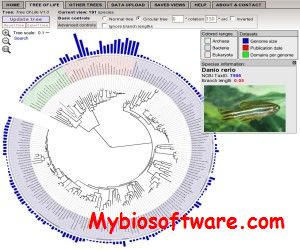
iTOL (Interactive Tree Of Life) is an online tool for the display and manipulation of phylogenetic trees. It provides most of the features available in other tree viewers, and offers a novel circular tree layout, which makes it easy to visualize mid-sized trees (up to several thousand leaves). Trees can be exported to several graphical formats, both bitmap and vector based.

::DEVELOPER

Bork Group

:: SCREENSHOTS

:: REQUIREMENTS

  • Web Browser (Firefox)

:: DOWNLOAD

 iTOL

:: MORE INFORMATION

Citation

Interactive Tree Of Life (iTOL) v4: recent updates and new developments.
Letunic I, Bork P.
Nucleic Acids Res. 2019 Jul 2;47(W1):W256-W259. doi: 10.1093/nar/gkz239.

Bioinformatics. 2007 Jan 1;23(1):127-8. Epub 2006 Oct 18.
Interactive Tree Of Life (iTOL): an online tool for phylogenetic tree display and annotation.
Letunic I, Bork P.

Letunic I and Bork P (2011)
Nucleic Acids Res doi: 10.1093/nar/gkr201
Interactive Tree Of Life v2: online annotation and display of phylogenetic trees made easy

MapInspect – Compare & Display Linkage Maps

MapInspect

:: DESCRIPTION

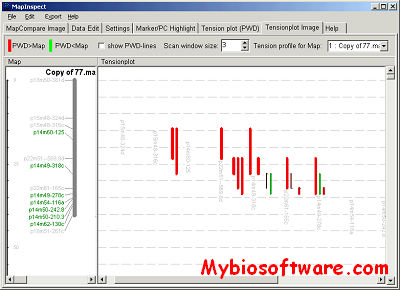
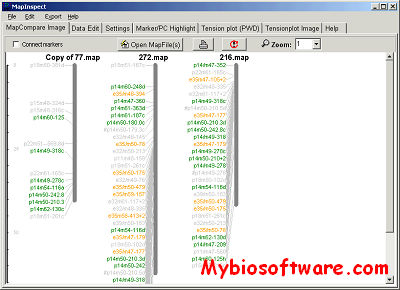
Mapinspect features Map Comparison, marker highlighting and graphical display of Pair-wise recombination estimates on the final map.

MapInspect can display, print and save these images, and has no limit to the number of maps it can compare (but only neighbouring maps are compared). Maps can be flipped within MapINspect, an the on-screen order of the maps can be changed.

::DEVELOPER

Wageningen UR Plant Breeding

:: SCREENSHOTS

:: REQUIREMENTS

  • Windows

:: DOWNLOAD

MapInspect

:: MORE INFORMATION

Prf-browser 2.6 – Browse and Display Gene Expression Profiles

Prf-browser 2.6

:: DESCRIPTION

Prf browser is the program to plot expression profiles and to browse Peak-mapper, Event-mapper data, profiles for extracted genes from directory “genes” created by Glob-mapper or profiles by the unique gene identifiers (i.e. d2378). Prf-browser requires profile data (*.rsz or *aln) and the ID file with gene names as well.

::DEVELOPER

Dmitri Papatsenko

:: SCREENSHOTS

N/A

:: REQUIREMENTS

  • Windows

:: DOWNLOAD

 Prf browser

:: MORE INFORMATION

Citation

Goltsev Y, Papatsenko D.
Time warping of evolutionary distant temporal gene expression data based on noise suppression
BMC Bioinformatics. 2009 Oct 26;10:353.

FCSViewer 2.0 – Decompresses FCS data files for Display

FCSViewer 2.0

:: DESCRIPTION

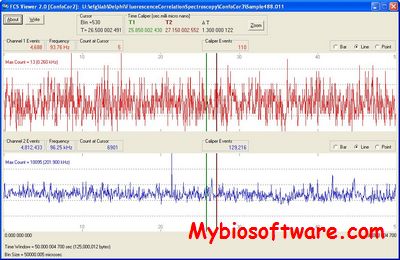
FCSViewer program is to decompress a file with Zeiss Fluorescence Correlation Spectroscopy (FCS) data (in either ConfoCor 2 or ConfoCor 3 formats) and display the two channels.  In addition, time “calipers” can be used to select and enlarge any time interval, and this can be repeated until the full resolution of the data is displayed.

::DEVELOPER

Earl F Glynn

:: SCREENSHOTS

:: REQUIREMENTS

  • Windows

:: DOWNLOAD

  FCSViewer , Source Code, for R

:: MORE INFORMATION

Distributed under GNU General Public License
www.gnu.org/licenses/gpl.txt

Grid Map 3.0a-beta – Displays Genome Mapping Data in a Grid Format

Grid Map 3.0a-beta

:: DESCRIPTION

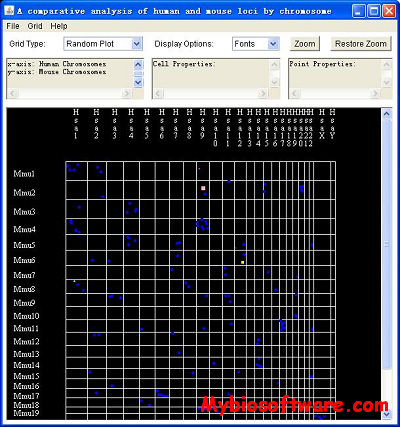
Grid Map was designed to display comparative genome mapping data in a grid format. It is a generic Java version of the Oxford Grid display (written for the ACEDB database software package), but can be used to display many kinds of gridded data.

::DEVELOPER

 DICKS COMPUTATIONAL BIOLOGY GROUP

:: SCREENSHOTS

:: REQUIREMENTS

  • Windows/ Linux / Mac OsX
  • JAVA

:: DOWNLOAD

  Grid Map

:: MORE INFORMATION