Glo-DB – Genomic Locus Operations Database

Glo-DB

:: DESCRIPTION

Glo-DB is designed to perform position-based queries of genomic sequence annotations (features). It contains a query language that affords many different types of position searches via command line and graphical user interfaces, and incorporates various visualization tools.

::DEVELOPER

the Kim Laboratory

:: SCREENSHOTS

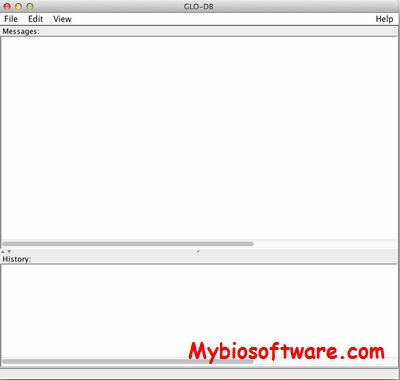
GLO-DB

:: REQUIREMENTS

  • Linux/ MacOsX/ Windows
  • java
  • Python

:: DOWNLOAD

 Glo-DB

:: MORE INFORMATION

pathrecon – Temporal Reconstruction Algorithm

pathrecon

:: DESCRIPTION

pathrecon is a set of algorithms for estimating temporal orderings from unordered sets of sample elements.

::DEVELOPER

the Magwene lab, the Kim Laboratory

:: SCREENSHOTS

N/A

:: REQUIREMENTS

  • Windows/ Linux/ MacOsX
  • Python

:: DOWNLOAD

 pathrecon

:: MORE INFORMATION

Citation

Magwene, P. M., P. Lizardi, and J. Kim. 2003.
Reconstructing the temporal ordering of biological samples using microarray data.
Bioinformatics 19(7):842-850

Provable / randGen – Software for the Closest Substring Problem and the Planted (L,d)-Motif Problem

Provable / randGen

:: DESCRIPTION

Provable is a program for solving the closest substring problem.

randGen is a program for generating random instances of the planted (L,d)-motif problem

::DEVELOPER

Chen Lab  & Lusheng Wang 

:: SCREENSHOTS

N/A

:: REQUIREMENTS

  • Linux

:: DOWNLOAD

 Provable / randGen

:: MORE INFORMATION

Citation

IEEE/ACM Trans Comput Biol Bioinform. 2011 Sep-Oct;8(5):1400-10. doi: 10.1109/TCBB.2011.21.
Fast exact algorithms for the closest string and substring problems with application to the planted (L, d)-motif model.
Chen ZZ, Wang L.

GCAligner 1.0 – Alignment of Chemical data obtained by Gas Chromatography

GCAligner 1.0

:: DESCRIPTION

GCAligner  is a software designed to perform a preliminary alignment of chemical data obtained by gas chromatography. It was created to facilitate the comparison of multiple samples. The alignment algorithm is based on the comparison between each retention time, the following retention time in the same sample and its closest retention times in other samples. GCAligner is a java executable software running on any operating system. The input data file and the single output file containing the align data set are text files with tab delimited pieces of information.
See the software manual for further details.

::DEVELOPER

Simon Dellicour and Thomas Lecocq @ Evolutionary Biology & Ecology, Université Libre de Bruxelles

:: SCREENSHOTS

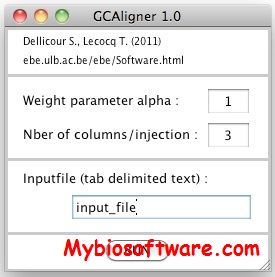
:: REQUIREMENTS

  • Windows / Linux / MacOsX
  • Java

:: DOWNLOAD

   GCAligner

:: MORE INFORMATION

MutaGeneSys 20071020 – Use Genome-wide Genotype Data to Estimate Individual Disease

MutaGeneSys 20071020

:: DESCRIPTION

MutaGeneSys  (Mutation Genome System) uses genome-wide genotype data to estimate individual disease susceptibility. Our system integrates three data sources: the International HapMap project(hapmap.org), whole-genome marker correlation data (description) and the Online Mendelian Inheritance in Man database (OMIM). MutaGeneSys accepts SNP data of individuals as query input and delivers disease susceptibility hypotheses even if the original set of typed SNPs is incomplete. Our system produces population, genotyping technology, and confidence-specific predictions in interactive time.

::DEVELOPER

Julia Stoyanovich 

:: SCREENSHOTS

N/A

:: REQUIREMENTS

  • Linux

:: DOWNLOAD

 MutaGeneSys

:: MORE INFORMATION

Citation:

Julia Stoyanovich and Itsik Pe’er 2008.
MutaGeneSys: Making Diagnostic Predictions Based on Genome-Wide Genotype Data in Association Studies
Bioinformatics (2008) 24 (3): 440-442

guiLiner 0.4 – Graphical User Interface for Biological Analysis Software

guiLiner 0.4

:: DESCRIPTION

GuiLiner is a generic, extensible and flexible front-end designed to “host” a wide variety of data analysis or simulation programs.Scientific application developers who produce a correctly formatted XML file describing their program’s options and some of its documentation can immediately use GuiLiner to produce a carefully implemented GUI for their analysis or simulation programs.

::DEVELOPER

Eric C. Anderson and Nicholas C. Manoukis

:: SCREENSHOTS

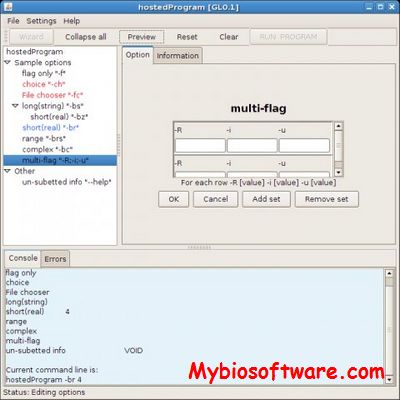
guiLiner

:: REQUIREMENTS

  • Linux/ MacOsX/ Windows
  • Java

:: DOWNLOAD

 guiLiner

:: MORE INFORMATION

LACS – Validate Protein NMR Chemical Shifts

LACS

:: DESCRIPTION

LACS ( linear analysis of chemical shifts) is a validation tool for protein backbone NMR chemical shift data. Based on the observation that secondary chemical shift (difference between the chemical shift of an amino acid and its random coil chemical shift) well indicate the local backbone geometry, LACS correlates the secondary chemical shifts of a nucleus to that of Ca-Cb of itself (referencing independent), thus avoiding any geometry or structure assumptions, to estimate referencing offsets and identify possible miss-assignments.

::DEVELOPER

Liya Wang

:: SCREENSHOTS

N/A

:: REQUIREMENTS

  • Windows
  • Matlab

:: DOWNLOAD

 LACS

:: MORE INFORMATION

Citation

Wang, L.; Eghbalnia, H. R.; Bahrami, A.; Markley, J. L.,
Linear analysis of carbon-13 chemical shift differences and its application to the detection and correction of errors in referencing and spin system identifications,
J. Biomol. NMR 25, 32, 13-22.

QuantileMap – Visualization of Compactlydemonstrate Multiple Distributions in Genomic Applications

QuantileMap

:: DESCRIPTION

QuantileMap is a visualization tool to compactlydemonstrate multiple (hundreds) distributions in genomic applications.

::DEVELOPER

George C. Tseng 

:: SCREENSHOTS

N/A

:: REQUIREMENTS

:: DOWNLOAD

 QuantileMap

:: MORE INFORMATION

Citation

George C. Tseng. (2009)
Quantile map: Simultaneous visualization of patterns in many distributions with application to tandem mass spectrometry.
Comput Stat Data Anal. 2010 April 1; 54(4): 1124.

GeoStaS 1.2 – Divides a biomolecule into Dynamic Domains

GeoStaS 1.2

:: DESCRIPTION

GeoStaS divides a biomolecule (proteins, nucleic acids and their complexes) into dynamic domains based on its different conformations, obtained from experiments or simulations.

::DEVELOPER

Biomolecular Machines Laboratory 

:: SCREENSHOTS

n/a

:: REQUIREMENTS

  • Linux

:: DOWNLOAD

 GeoStaS

:: MORE INFORMATION

Citation

Julia Romanowska Krzysztof S. Nowiński and Joanna Trylska
Determining Geometrically Stable Domains in Molecular Conformation Sets
J. Chem. Theory Comput., 2012, 8 (8), pp 2588–2599

ROMA – Calculation of Gene Set Activities from Oomics data

ROMA

:: DESCRIPTION

ROMA (Representation and quantification Of Module Activities) is a software package written in Java for the quantification and representation of biological module activity using gene expression or other omics data.

::DEVELOPER

Computational Systems Biology of Cancer group

:: SCREENSHOTS

N/A

:: REQUIREMENTS

  • Linux / Windows
  • Java

:: DOWNLOAD

ROMA

:: MORE INFORMATION

Citation:

Martignetti L, Calzone L, Bonnet E, Barillot E, Zinovyev A.
ROMA: Representation and Quantification of Module Activity from Target Expression Data.
Front Genet. 2016 Feb 19;7:18. doi: 10.3389/fgene.2016.00018. PMID: 26925094; PMCID: PMC4760130.