BIODICA – Independent Component Analysis for Big Omics Data

BIODICA

:: DESCRIPTION

BIODICA is a user-friendly pipeline for high-performant computation of independent components for omics data, using stability analysis and computing the optimal number of the components from their stabilities, and performing analyses for interpreting the results of ICA application.

::DEVELOPER

Computational Systems Biology of Cancer group

:: SCREENSHOTS

N/A

:: REQUIREMENTS

  • Linux / Windows
  • Java

:: DOWNLOAD

BIODICA

:: MORE INFORMATION

Citation:

Seisenova A, Daniyarov A, Molkenov A, Sharip A, Zinovyev A, Kairov U.
Meta-Analysis of Esophageal Cancer Transcriptomes Using Independent Component Analysis.
Front Genet. 2021 Oct 21;12:683632. doi: 10.3389/fgene.2021.683632. PMID: 34795689; PMCID: PMC8594933.

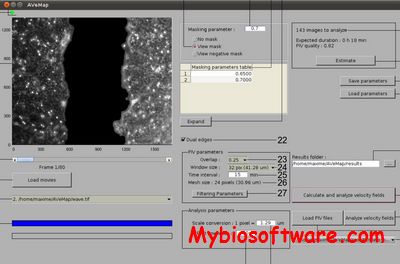
AVeMap – Cell Migration in Wound-healing Assays

AVeMap

:: DESCRIPTION

AVeMap is a powerful analysis software of collective cell migration in wound-healing assays.

::DEVELOPER

Biology inspired physics at mesoscales , Institut Curie

:: SCREENSHOTS

AVeMap

:: REQUIREMENTS

  • Windows / Mac OsX
  • Matlab

:: DOWNLOAD

 AVeMap

:: MORE INFORMATION

Citation

M. Deforet, M. C. Parrini, L. Petitjean, M. Biondini, A. Buguin, J. Camonis and P. Silberzan:
Automated Velocity Mapping of Migrating Cell Populations (AVeMap),
Nat Methods. 2012 Nov;9(11):1081-3. doi: 10.1038/nmeth.2209

VAMP 2.2.8 – Visualisation and Analysis of CGH arrays, transcriptome and other Molecular Profiles

VAMP 2.2.8

:: DESCRIPTION

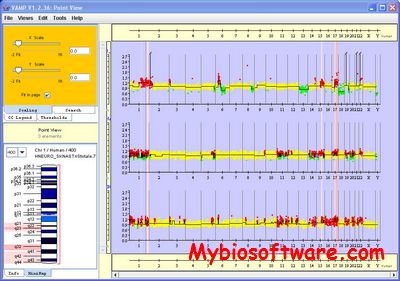
The VAMP software (Visualization and Analysis of array-CGH, transcriptome and other Molecular Profiles)allows the visual comparison of the array-CGH profiles of a cohort of patients, or the confrontation of array-CGH, expression and loss of heterozygosity profiles. VAMP offers many functionalities such as computing recurrent alterations, clustering profiles, crossing with clinical or biological annotations, performing syntenic projection onto the genome of another species.

::DEVELOPER

Bioinformatics Laboratory of Institut Curie (Paris).

:: SCREENSHOTS

:: REQUIREMENTS

  • Windows / Linux / Mac OsX
  • Java

:: DOWNLOAD

 VAMP

:: MORE INFORMATION

Citation:

Philippe La Rosa et al.
VAMP: Visualization and analysis of array-CGH, transcriptome and other molecular profiles
Bioinformatics 2006 22: 2066-2073;

RNA-Scoop v1.0.1 – Interactive Visualization of Single-cell Transcriptomes

RNA-Scoop v1.0.1

:: DESCRIPTION

RNA Scoop is a tool to visualize isoforms in single cell transcriptomes. Through use of an interactive cell cluster plot, users are able to explore isoforms in a single-cell transcriptome dataset of thousands of cells.

::DEVELOPER

Canada’s Michael Smith Genome Sciences Centre

:: SCREENSHOTS

N/A

:: REQUIREMENTS

  • Linux
  • JRE

:: DOWNLOAD

RNA Scoop

:: MORE INFORMATION

Citation

Stephenson M, Nip KM, HafezQorani S, Gagalova KK, Yang C, Warren RL, Birol I.
RNA-Scoop: interactive visualization of transcripts in single-cell transcriptomes.
NAR Genom Bioinform. 2021 Nov 29;3(4):lqab105. doi: 10.1093/nargab/lqab105. PMID: 34859209; PMCID: PMC8633890.

SGNNMD – Signed Graph Neural Network for Predicting Deregulation Types of MiRNA-disease Associations

SGNNMD

:: DESCRIPTION

SGNNMD extracts subgraphs around miRNA-disease pairs from the signed bipartite network and learns structural features of subgraphs via a labeling algorithm and a neural network, and then combines them with biological features (i.e. miRNA-miRNA functional similarity and disease-disease semantic similarity) to build the prediction model.

::DEVELOPER

Zhang Wen

:: SCREENSHOTS

N/A

:: REQUIREMENTS

  • Linux
  • Python

:: DOWNLOAD

SGNNMD

:: MORE INFORMATION

Citation

Zhang G, Li M, Deng H, Xu X, Liu X, Zhang W.
SGNNMD: signed graph neural network for predicting deregulation types of miRNA-disease associations.
Brief Bioinform. 2021 Dec 8:bbab464. doi: 10.1093/bib/bbab464. Epub ahead of print. PMID: 34875683.

Dotter 20131114 – Dot-matrix Program with Interactive Greyscale Rendering

Dotter 20131114

:: DESCRIPTION

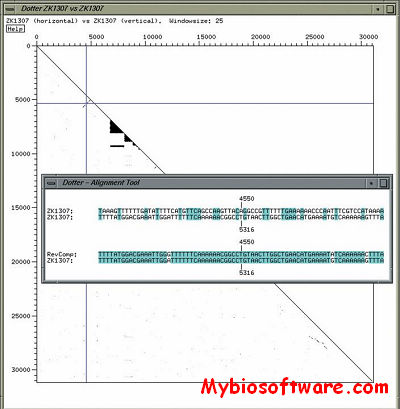
Dotter is a graphical dotplot program for detailed comparison of two sequences. Here, every residue in one sequence is compared to every residue in the other sequence. The first sequence runs along the x-axis and the second sequence along the y-axis. In regions where the two sequences are similar to each other, a row of high scores will run diagonally across the dot matrix. If you’re comparing a sequence against itself to find internal repeats, you’ll notice that the main diagonal scores maximally, since it’s the 100% perfect self-match.

::DEVELOPER

Dr. Erik Sonnhammer

:: SCREENSHOTS

:: REQUIREMENTS

  • Linux / Windows / MacOsX

:: DOWNLOAD

Dotter

:: MORE INFORMATION

Citation:

A dot-matrix program with dynamic threshold control suited for genomic DNA and protein sequence analysis
Erik L.L. Sonnhammer a,), Richard Durbin

LDA 1.6.2 – Lipid Data Analyzer

LDA 1.6.2

:: DESCRIPTION

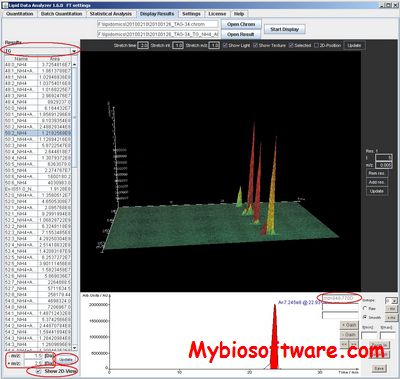
LDA provides standardisation, a statistics module for results analysis, a batch mode for unattended analysis of several runs and a 3D viewer for the manual verification.

::DEVELOPER

Genomics & Bioinformatics Graz, Graz University of Technology

:: SCREENSHOTS

:: REQUIREMENTS

  • Linux / Windows / MacOsX
  • Java

:: DOWNLOAD

 LDA

:: MORE INFORMATION

Citation

Hartler J, Trötzmüller M, Chitraju C, Spener F, K?feler HC, Thallinger GG.
Lipid Data Analyzer: unattended identification and quantitation of lipids in LC-MS data.
Bioinformatics. 2011 Feb 15, 27(4), 572-577. Epub 2010 Dec 17.

Grid Cell Counter 0.9.9 – Count the Cells Shown on Computer Screen

Grid Cell Counter 0.9.9

:: DESCRIPTION

Grid Cell Counter is a freeware biology tool that will help you to manually count the cells shown on computer screen by displaying a transparent or semi-transparent grid over your image.

::DEVELOPER

Heracle BioSoft

:: SCREENSHOTS

:: REQUIREMENTS

  • Windows

:: DOWNLOAD

Grid Cell Counter

:: MORE INFORMATION

GO2MSIG 20131106 – GO based GSEA Gene Set Generator

GO2MSIG 20131106

:: DESCRIPTION

GO2MSIG generates collections of gene sets in MSigDB format based on the Gene Ontology (GO) project hierarchy and gene association data, for use with the Gene Set Enrichment Analysis (GSEA) implementation available at the Broad Institute. This enables rapid creation of gene set collections for multiple species.

::DEVELOPER

Justin Powell (jacp10 at bioinformatics.org)

:: SCREENSHOTS

N/A

:: REQUIREMENTS

  • Linux / windows/ MacOsX
  • Perl
  • Web Server
  • MySQL

:: DOWNLOAD

 GO2MSIG

:: MORE INFORMATION

Cell Counter 4.0 – Count Cells

Cell Counter 4.0

:: DESCRIPTION

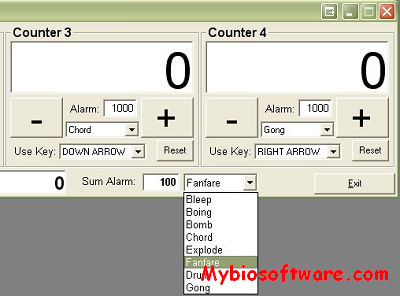
Cell Counter is for counting cells (or other things). There is a choice for 4, 8, 12, 16 counters. Different (default) alarms and names. There is also a total sum with alarm. Custom settings, copy to Excel, etc..

::DEVELOPER

the Cellular Imaging Core Facility

:: SCREENSHOTS

:: REQUIREMENTS

  • Windows

:: DOWNLOAD

Cell Counter

:: MORE INFORMATION

This software is free to anyone, just for fun send author a postcard:
AMC, Cell biology & Histology CMO, Ron Hoebe, Room M3-106-1
Meibergdreef 15, 1105 AZ  Amsterdam, The Netherlands