MulteeSum – Visualize Comparison of Cellular Gene Expression Profiles

MulteeSum

:: DESCRIPTION

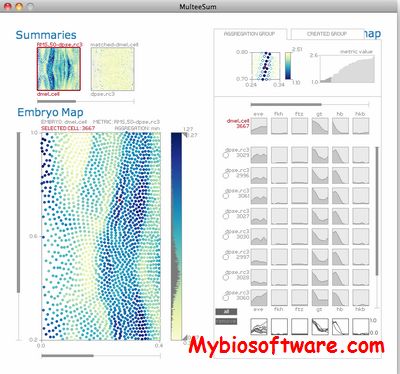
MulteeSum is a visualization system that supports inspection and curation of data sets showing gene expression over time, in conjunction with the spatial location of the cells where the genes are expressed — it is the first tool to support comparisons across multiple such datasets.

::DEVELOPER

Miriah Meyer & DePace Lab

:: SCREENSHOTS

multeesum

:: REQUIREMENTS

  • Linux/ Windows/ MacOsX

:: DOWNLOAD

 MulteeSum 

:: MORE INFORMATION

Citation:

IEEE Trans Vis Comput Graph. 2010 Nov-Dec;16(6):908-17. doi: 10.1109/TVCG.2010.137.
MulteeSum: a tool for comparative spatial and temporal gene expression data.
Meyer M, Munzner T, DePace A, Pfister H.
QUMA 1.1.13 – Visualize and Quantify Bisulfite Sequence data for CpG Methylation Analysis

QUMA 1.1.13

:: DESCRIPTION

QUMA (QUantification tool for Methylation Analysis)is a web-based tool for CpG methylation analysis.Youcan easily align, visualize and quantify bisulfite sequence data for CpG methylation analysis

::DEVELOPER

Laboratory for Mammalian Epigenetic StudiesCenter for Developmental BiologyRIKEN

:: SCREENSHOTS

:: REQUIREMENTS

  • Linux

:: DOWNLOAD

 QUMA

:: MORE INFORMATION

Citation

Yuichi Kumaki, Masaaki Oda & Masaki Okano
QUMA: quantification tool for methylation analysis
Nucleic Acids Res. 36, W170-W175 (2008).

bioView3D 0.1.18 – Visualize 3D Stack Image

bioView3D 0.1.18

:: DESCRIPTION

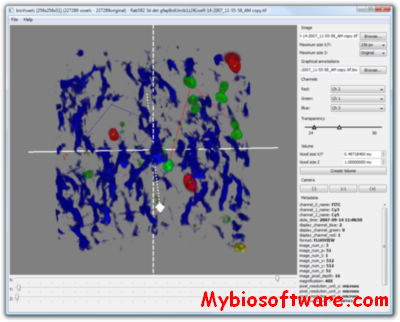
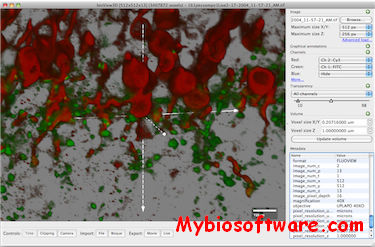
bioView3D is an open source and cross-platform application intended for biologists to visualize 3D stack (laser scanning confocal, etc.) imagery.

::DEVELOPER

The Center for Bio-Image Informatics

:: SCREENSHOTS

:: REQUIREMENTS

  • Windows / Linux / Mac OsX

:: DOWNLOAD

bioView3D

:: MORE INFORMATION

Citation:

Kristian Kvilekval, Dmitry Fedorov, Boguslaw Obara, Ambuj Singh and B.S. Manjunath,
Bisque: A Platform for Bioimage Analysis and Management
Bioinformatics, vol. 26, no. 4, pp. 544-552, Feb. 2010.

AminoNet 2.0 – Create, Visualize and Analyse Protein Network

AminoNet 2.0

:: DESCRIPTION

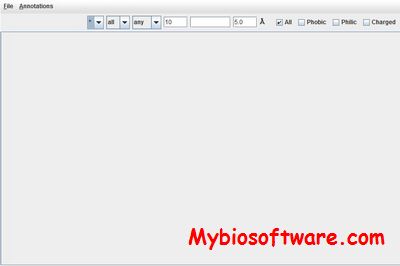
AMINONET is a Java-based software tool to construct different protein contact networks (unweighted and weighted; long range, short range and any range; hydrophobic, hydrophilic, charged or all-amino-acid networks). The networks thus constructed can be visualized. The software will also help in the calculation of the values of the different topological parameters of the constructed networks.

::DEVELOPER

 Md. Aftabuddin, Sudip Kundu

:: SCREENSHOTS

:: REQUIREMENTS

  • Windows / Mac /  Linux
  • Java

:: DOWNLOAD

 AminoNet

:: MORE INFORMATION

Citation

Md. Aftabuddin and S. Kundu
AMINONET – a tool to construct and visualize amino acid networks, and to calculate topological parameters
J. Appl. Cryst. (2010). 43, 367-369

GenoPlayer 20070621 – Visualizing and Querying Genetic Data

GenoPlayer 20070621

:: DESCRIPTION

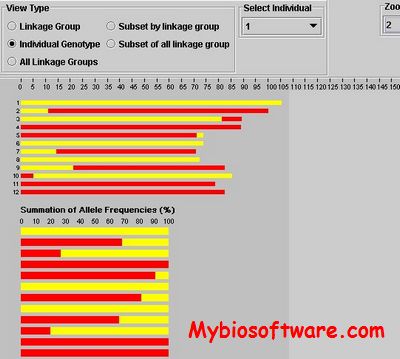
GenoPlayer is a software which is useful for visualization and manual refinement of MapPop results. Genome analysis based on molecular markers can generate large amount of information. A graphical display and visualization of the data provides a powerful overview of information and can simplify interpretation. We developed a JAVA software package, GenoPlayer, for visualizing and querying genetic linkage data. The program displays chromosomal genotypes of individuals based on molecular marker data. GenoPlayer can be used to select informative markers, to identify the most useful individuals in a segregating population, to detect segregation distortion, and to detect errors in the data.

::DEVELOPER

the Michelmore lab at UC Davis

:: SCREENSHOTS

:: REQUIREMENTS

  • Windows / Linux / MacOsX
  • Java

:: DOWNLOAD

 GenoPlayer

:: MORE INFORMATION

VLAD 1.5.1 – Visualize GO Annotations

VLAD 1.5.1

:: DESCRIPTION

VLAD (VisuaL Annotation Display) is a tool for visualizing GO annotations. The annotation data are a subset of those available at the GO web site. You specify an annotation data set and a set of genes, and the tool will produce a graphical summary of the annotations.

::DEVELOPER

MGI Group

:: SCREENSHOTS

:: REQUIREMENTS

:: DOWNLOAD

 VLAD

:: MORE INFORMATION

Citation

J Reprod Dev. 2009 Dec;55(6):670-5. Epub 2009 Sep 29.
Expression profiling of tetraploid mouse embryos in the developmental stages using a cDNA microarray analysis.
Kawaguchi J, Kano K, Naito K.

AsVis 20051125 – Visualizing Association Rules in SNP Neighborhoods

AsVis 20051125

:: DESCRIPTION

AsVis is a web application for visualizing association rules obtained from short, sequential data (such as SNP neighborhoods) by means of data mining. It allows the association rules to be sorted by a variety of measures and filtered by position, enabling fast, interactive data exploration.

::DEVELOPER

Group of Data mining in genetics 

:: SCREENSHOTS

N/A

:: REQUIREMENTS

  • Linux
  • Web Server
  • CGI

:: DOWNLOAD

 AsVis

:: MORE INFORMATION

Citation

Kimmo Kulovesi et al
Visualisation of Associations Between Nucleotides in SNP Neighbourhoods
Workshop on Intelligent Data Analysis in bioMedicine and Pharmacology (IDAMAP’06), Verona, Italy, August 2006.

GUPPY 0.988 – Visualize Sequence Annotation Data

GUPPY 0.988

:: DESCRIPTION

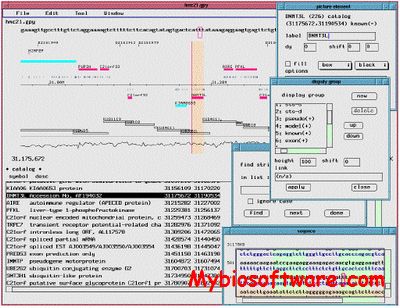
GUPPY (Genetic Understanding Perspective Preview sYstem) is a program to visualize sequence annotation data of the genetic sequence data with graphical layout. This highly interactive program allows smooth scrolling and zooming from the genomic landscape to discrete nucleic acid sequences. Its main function is quick rendering of data on a standalone personal computer to save the layout as a parsonal file. With optional link to the internet resources, and printing support, this program tries to make more greater use of computational media in research actitiviy.

::DEVELOPER

Yutaka Ueno, AIST Tsukuba

:: SCREENSHOTS

:: REQUIREMENTS

  • Linux
  • C++ compiler

:: DOWNLOAD

 GUPPY

:: MORE INFORMATION

Citation

Ueno Y, Arita M, Kumagai T, Asai K.
Processing sequence annotation data using the Lua programming language.
Genome Inform. 2003;14:154-63.

H-BloX 1.47N – Visualizing Alignment Block Entropies

H-BloX 1.47N

:: DESCRIPTION

H-BloX is a web-based JavaScript application that allows the calculation and visualization of Shannon information content or relative entropy (Kullback-Leibler ‘distance’) within sequence alignment blocks. The application was designed for use in both teaching and research. Amino acid, nucleic acid sequences, or any other type of aligned chemical structures may serve as the input.

::DEVELOPER

ModLab

:: SCREENSHOTS

N/A

:: REQUIREMENTS

  • Windows / Mac /  Linux
  • Java

:: DOWNLOAD

  H-BloX

:: MORE INFORMATION

Citation

Zuegge, J., Ebeling, M., Schneider, G., (2001)
H-BloX: visualizing alignment block entropies.
J. Mol. Graph. Model., 19 (3-4), 303.

Parasight 7.6 – Visualize and Analyze Biological Pairwise Alignments

Parasight 7.6

:: DESCRIPTION

Parasight is a program for visualizing and analyzing biological pairwise alignments. The program was initially designed to analyze the thousands of large segmental duplications found within the human genome. However, parasight’s simple unassuming data model and flexible formatting allows for the display of virtually any pairwise alignment as well as formatting based on any ancillary data. It is most often used in the Eichler lab, to quickly analyze everyday BLAST searches of genomic sequence.

::DEVELOPER

Eichler Lab 

:: SCREENSHOTS

N/A

:: REQUIREMENTS

:: DOWNLOAD

 Parasight

:: MORE INFORMATION