MapChart 2.2 – Graphical Presentation of Linkage Maps and QTLs

MapChart 2.2

:: DESCRIPTION

MapChart is a Windows software for the graphical presentation of linkage maps and QTLs. These charts are composed of a sequence of vertical bars representing the linkage groups or chromosomes. On these bars the positions of loci are indicated, and next to the bars QTL intervals and QTL graphs can be shown. MapChart reads the linkage information (i.e. the locus and QTL names and their positions) from text files.

::DEVELOPER

dr. RE (Roeland) Voorrips

:: SCREENSHOTS

N/A

:: REQUIREMENTS

  • Windows

:: DOWNLOAD

  MapChart

:: MORE INFORMATION

Citation:

Voorrips, R.E., 2002.
MapChart: Software for the graphical presentation of linkage maps and QTLs.
The Journal of Heredity 93 (1): 77-78.

imappingfamily – QTL Detection in a Population with Family Structure

imappingfamily

:: DESCRIPTION

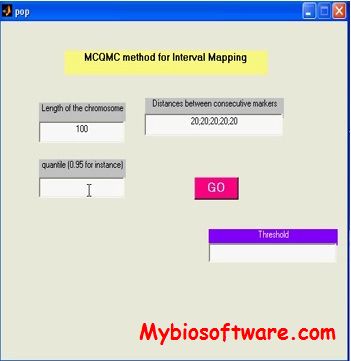
 imappingfamily is a package with a graphical interface regrouping the different methods presented in the article submitted “Quantitative Trait Locus Detection in a population with family structure”.

::DEVELOPER

Charles-Elie Rabier

:: SCREENSHOTS

:: REQUIREMENTS

  • Linux/windows / MacOsX
  • Matlab

:: DOWNLOAD

 imappingfamily

:: MORE INFORMATION

Citation

Rabier C-E, Azais J-M, Elsen J-M, Delmas C.
Quantitative Trait Locus Detection in a population with family structure
(submitted)

imapping – Likelihood Ratio Test process for QTL Detection

imapping

:: DESCRIPTION

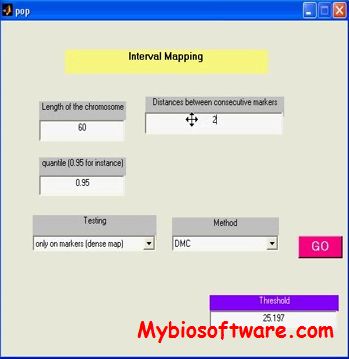
imapping is a package with a graphical interface implementing the method presented in the article submitted “Likelihood Ratio Test Process for Quantitative Trait Locus Detection”.

::DEVELOPER

Charles-Elie Rabier

:: SCREENSHOTS

:: REQUIREMENTS

  • Linux/windows / MacOsX
  • Matlab

:: DOWNLOAD

 imapping

:: MORE INFORMATION

Citation

Charles-Elie Rabier, Jean-Marc Azais, Céline Delmas
Likelihood Ratio Test process for Quantitative Trait Loci Detection

R/qtlDesign 0.91 – Software for QTL Experimental Design

R/qtlDesign 0.91

:: DESCRIPTION

R/qtlDesign is software to help plan quantitative trait locus (QTL) experiments.

::DEVELOPER

saunak sen

:: SCREENSHOTS

N/A

:: REQUIREMENTS

:: DOWNLOAD

 R/qtlDesign

:: MORE INFORMATION

Citation

Mamm Genome. 2007 Feb;18(2):87-93. Epub 2007 Mar 8.
R/qtlDesign: inbred line cross experimental design.
Sen S, Satagopan JM, Broman KW, Churchill GA.

MetaQTL 1.2.0 – Meta-analysis of QTL Mapping Experiments

MetaQTL 1.2.0

:: DESCRIPTION

MetaQTL is a Java package designed to perform the integration of data from the field of gene mapping experiments (e.g molecular markers, QTL, candidate genes, etc…). This package consists in a modular library and several programs written in pure Java. These programs can perform various tasks, including formatting, analyzing and visualizing data or results produced by MetaQTL.

::DEVELOPER

Jean-Baptiste Veyrieras

:: SCREENSHOTS

N/A

:: REQUIREMENTS

  • Windows / Linux / MacOsX
  • Java

:: DOWNLOAD

 MetaQTL

:: MORE INFORMATION

Citation:

MetaQTL: a package of new computational methods for the meta-analysis of QTL mapping experiments.
Veyrieras JB, Goffinet B, Charcosset A.
BMC Bioinformatics. 2007 Feb 8;8:49.

MGA-MAPF 2 – Map QTL in Model Organisms using a data coming from Backcrosses

MGA-MAPF 2

:: DESCRIPTION

MGA-MAPF is an imple, thou powerful and easy to modificate Fortran program to map QTLs in F-2 intercross in model organisms

::DEVELOPER

Yurii Aulchenko ( yurii@bionet.nsc.ru) @ Laboratory of the Methods of Genetic Analysis , Institute of Cytology and Genetics, Novosibirsk, Russia.

:: SCREENSHOTS

N/A

:: REQUIREMENTS

  • Window

:: DOWNLOAD

 MGA-MAPF

:: MORE INFORMATION

Pseudomarker 2.04 – Analysis of QTL data from Inbred Line Crosses

Pseudomarker 2.04

:: DESCRIPTION

PSEUDOMARKER is a set of programs written in MATLAB for the analysis of QTL data from inbred line crosses.

::DEVELOPER

The Churchill Group

:: SCREENSHOTS

N/A

:: REQUIREMENTS

  • Linux / Windows/ MacOsX
  • Matlab

:: DOWNLOAD

PSEUDOMARKER

:: MORE INFORMATION

Citation

A statistical framework for quantitative trait mapping
Sen S, Churchill GA.
Genetics. 2001 Sep;159(1):371-87. PMCID: PMC1461799

TWINSIM – Simulate Twin-nuclear Families in which QTLs and Linked Markers are Segregating

TWINSIM

:: DESCRIPTION

TWINSIM generates nuclear families, a proportion of which contain monozygotic twins, in which multiple quantitative trait loci are segregating. One of these QTLs is linked to multiple markers. Families can be selected to contain high and/or low values at the quantitative or ordinal trait.

::DEVELOPER

David Duffy

:: SCREENSHOTS

N/A

:: REQUIREMENTS

  • Windows /MacOsX /  Linux
  • Frotran 77

:: DOWNLOAD

 TWINSIM

:: MORE INFORMATION

QGene 4.3.10 – Software for QTL data exploration

QGene 4.3.10

:: DESCRIPTION

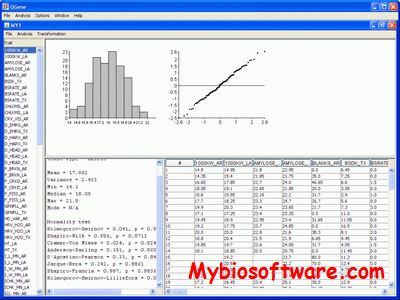
QGene is a free, open-source Java program that runs on any computer operating system. It is intended for doing comparative analyses of QTL mapping data sets in computationally efficient ways that are of maximum use to analysts. It is also written with a plug-in architecture for ready extensibility.

::DEVELOPER

Clare Nelson

:: SCREENSHOTS

:: REQUIREMENTS

  • Linux/Windows/MacOsX
  • java

:: DOWNLOAD

 QGene

:: MORE INFORMATION

Citation

Joehanes R, Nelson JC. 2008.
QGene 4.0, an extensible Java QTL-analysis platform.
Bioinformatics 24: 2788-2789.

MAPL98 – Linkage Mapping & QTL Analysis

MAPL98

:: DESCRIPTION

MAPL98 is a software for constructing  detailed linkage maps of organisms and analysis of quantitative trait loci(QTLs) and can be run on a personal computer which will be available in an  ordinal laboratory. It provides experimenter freindly computer environment.

::DEVELOPER

Yasuo UKAI

:: SCREENSHOTS

N/A

:: REQUIREMENTS

  • Windows

:: DOWNLOAD

MAPL98

:: MORE INFORMATION

When you publish a paper including results which were obtained by utilizing Mapl, then please put a short sentence in your paper telling that “Mapl98 was used.” .