MIRACLE 1.0.2 / Rmiracle – Microarray R-based Analysis of Complex Lysate Experiments

MIRACLE 1.0.2/ Rmiracle

:: DESCRIPTION

MIRACLE is a web-application for handling reverse phase protein array chips

RmiracleR package for analysis of reverse phase protein array data in conjunction with MIRACLE.

::DEVELOPER

Baumbach lab

:: SCREENSHOTS

N/A

:: REQUIREMENTS

:: DOWNLOAD

 MIRACLE , Rmiracle

:: MORE INFORMATION

Citation:

Microarray R-based analysis of complex lysate experiments with MIRACLE.
List M, Block I, Pedersen ML, Christiansen H, Schmidt S, Thomassen M, Tan Q, Baumbach J, Mollenhauer J.
Bioinformatics. 2014 Sep 1;30(17):i631-i638.

Mayday 2.14 – Microarray Data Analysis

Mayday 2.14

:: DESCRIPTION

Mayday (Microarray Data Analysis)is a workbench for visualization, analysis and storage of microarray data.

Mayday offers a variety of plug-ins, such as various interactive viewers, a connection to the R statistical environment, a connection to SQL-based databases, and different clustering methods, including phylogenetic methods.

In addition, so-called meta information objects are provided for annotation of the microarray data allowing integration of data from different sources. This meta information can be used to enhance visualizations, such as in the enhanced heatmap visualization.

::DEVELOPER

Research Group “Integrative Transcriptomics” , Center for Bioinformatics Tübingen, University of Tübingen

:: SCREENSHOTS

:: REQUIREMENTS

:: DOWNLOAD

Mayday

:: MORE INFORMATION

Citation

Florian Battke, Stephan Symons and Kay Nieselt: Mayday – Integrative analytics for expression data;
BMC Bioinformatics 11 (1):121 (2010)

CalMaTe 0.12.1 – Improved Allele-Specific Copy Number of SNP Microarrays for Downstream Segmentation

CalMaTe 0.12.1

:: DESCRIPTION

CalMaTe is a multi-array post-processing method of allele-specific copy-number estimates (ASCNs).

::DEVELOPER

Henrik Bengtsson <henrikb at braju.com>

:: SCREENSHOTS

N/A

:: REQUIREMENTS

  • Windows/Linux/ MacOsX
  • R

:: DOWNLOAD

 CalMaTe

:: MORE INFORMATION

Citation

Bioinformatics. 2012 Jul 1;28(13):1793-4. doi: 10.1093/bioinformatics/bts248. Epub 2012 May 9.
CalMaTe: a method and software to improve allele-specific copy number of SNP arrays for downstream segmentation.
Ortiz-Estevez M1, Aramburu A, Bengtsson H, Neuvial P, Rubio A.

SEL.TS.AREA v2 – Significance Analysis of Microarray Transcript Levels in Time Series Experiments

SEL.TS.AREA v2

:: DESCRIPTION

SEL.TS.AREA selects differentially expressed genes in time series experiments based on the area of the region bounded by the time series expression profiles to be compared, and considers the gene differentially expressed if the area exceeds a threshold based on  a model of the experimental error.

::DEVELOPER

Barbara Di Camillo

:: SCREENSHOTS

N/A

:: REQUIREMENTS

  • Windows/MacOsX/Linux
  • R package

:: DOWNLOAD

  SEL.TS.AREA

:: MORE INFORMATION

Citation

BMC Bioinformatics. 2007 Mar 8;8 Suppl 1:S10.
Significance analysis of microarray transcript levels in time series experiments.
Di Camillo B, Toffolo G, Nair SK, Greenlund LJ, Cobelli C.

InCroMAP 1.5 – Integrated Analysis of Cross-platform MicroArray and Pathway data

InCroMAP 1.5

:: DESCRIPTION

InCroMAP is a powerful tool for pathway-based analysis or visualization of heterogeneous cross-platform microarray datasets (mRNA, miRNA, DNA methylation and protein).

::DEVELOPER

InCroMAP TEam

:: SCREENSHOTS

InCroMAP

:: REQUIREMENTS

  • Windows / Linux / MacOsX
  • Java

:: DOWNLOAD

 InCroMAP

:: MORE INFORMATION

Citation:

InCroMAP: integrated analysis of cross-platform microarray and pathway data.
Wrzodek C, Eichner J, Büchel F, Zell A.
Bioinformatics. 2013 Jan 16.

SuperPC 1.05 – Survival and Regression Analysis for Microarrays

SuperPC 1.05

:: DESCRIPTION

SuperPC, written in the R language, does prediction for a censored survival outcome, or a regression outcome, using the “supervised principal component” approach. It is especially useful when the number of features p is >> n, the number of samples, for example in microarray studies.

::DEVELOPER

Rob Tibshirani

:: SCREENSHOTS

N/A

:: REQUIREMENTS

  • Windows/Linux/MacOsX
  • R package

:: DOWNLOAD

  SuperPC

:: MORE INFORMATION

Citation

PLoS Biol. 2004 Apr;2(4):E108. Epub 2004 Apr 13.
Semi-supervised methods to predict patient survival from gene expression data.
Bair E, Tibshirani R.

Arrayplot 3.01 – Visalisuation and Normalisation of Microarray data

Arrayplot 3.01

:: DESCRIPTION

Arrayplot has been designed to allow rapid visalisuation and normalisation of microarray data. It provides a user-friendly interface to visualise data distribution and to view most variant genes. It permits to calculate normalisation factor based on overall median intensity.

::DEVELOPER

Jacq’s group

:: SCREENSHOTS

Arrayplot

:: REQUIREMENTS

  • Windows

:: DOWNLOAD

 Arrayplot

:: MORE INFORMATION

Citation

Bioinformatics. 2002 Jun;18(6):888-9.
Arrayplot for visualization and normalization of cDNA microarray data.
Marc P, Jacq C.

MALA – MicroArray Logic Analyzer

MALA

:: DESCRIPTION

MALA is specifically designed for the analysis of Microarray data. The rational data representing the gene expressions is discretized into a limited number of intervals for each cell of the array; the obtained discrete variables are then used to select a small subset of the genes that have strong discriminating power for the considered classes. The optimization algorithms for feature selection and logic formula extraction are then used to identify networks of genes – and related thresholds on their expression level – that characterize the classes.

::DEVELOPER

DMB (Data Mining Big) Team

:: SCREENSHOTS

MALA

:: REQUIREMENTS

  • Windows/Linux/MacOsX
  • java

:: DOWNLOAD

 MALA

:: MORE INFORMATION

Citation

Weitschek E, Felici G, Bertolazzi P (2012)
MALA: A microarray clustering and classification software
IEEE Database and Expert Systems Applications (DEXA), 2012 23rd International Workshop on Page(s):201 – 205

HCE 3.5 – Interactive Power Analysis for Microarray Hypothesis Testing and Generation

HCE 3.5

:: DESCRIPTION

The HCE (Hierarchical Clustering Explorer) power analysis tool was designed to import any pre-existing microarray project, and interactively test the effects of user-defined definitions of α (significance), β (1-power), sample size, and effect size. The tool generates a filter for all probe sets or more focused ontology-based subsets, with or without noise filters that can be used to limit analyses of a future project to appropriately powered probe sets. We studied projects from three organisms (Arabidopsis, rat, human), and three probe set algorithms (MAS5.0, RMA, dChip PM/MM). We found large differences in power results based on probe set algorithm selection and noise filters. RMA provided exquisite sensitivity for low numbers of arrays, but this came at a cost of high false positive results (24% false positive in the human project studied). Our data suggests that a priori power calculations are important for both experimental design in hypothesis testing, and hypothesis generation, as well as for selection of optimized data analysis parameters.

::DEVELOPER

Ben Shneiderman, Jinwook Seo
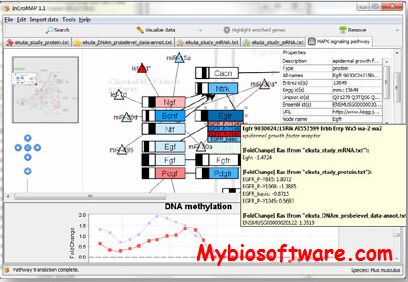
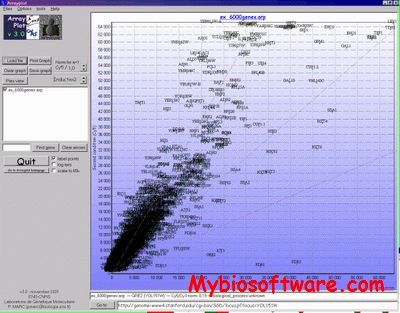
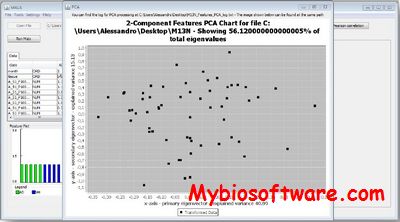
:: SCREENSHOTS

:: REQUIREMENTS

  • Windows

:: DOWNLOAD

  HCE

:: MORE INFORMATION

Citation

Jinwook Seo, Heather Gordish-Dressman, Eric P. Hoffman,
An Interactive Power Analysis Tool for Microarray Hypothesis Testing and Generation,”
Bioinformatics, Vol. 22, No. 7, pp. 808-814, 2006.