Spotfinder v3.2.1
:: DESCRIPTION
Spotfinder is an image processing program created at The Institute for Genomic Research (J. Craig Venter Institute now) for analysis of the image files generated in microarray expression studies. Spotfinder uses a fast and reproducible algorithm to identify the spots on array and provide quantitation of expression levels.
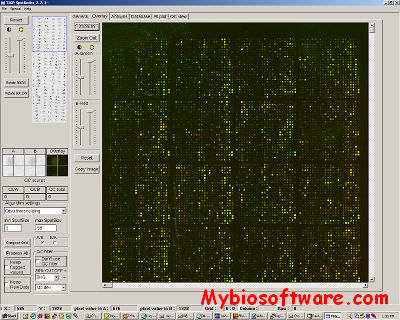
Image analysis is a crucial step in the microarray process. TIGR Spotfinder was designed for the rapid, reproducible and computer-aided analysis of microarray images and the quantification of gene expression. TIGR Spotfinder reads paired 16-bit or 8-bit TIFF image files generated by most microarray scanners. Semi-automatic grid construction defines the areas of the slide where spots are expected. Automatic and manual grid adjustments help to ensure that each rectangular grid cell is centered on a spot. Two available segmentation methods (histogram and Otsu) define the boundaries between each spot and the surrounding local background. Spot intensities are calculated as an integral of non-saturated pixels, although other options including spot median and mean values are available. Local background subtraction for each reported value is applied by default but can be disabled. The calculated intensities, medians, and means along with each spot position on the array, spot area, background values, and quality control flags are written to a MEV file or the database. Reusable grid geometry files and automatic grid adjustment allow user to analyze large quantities of images in a consistent and efficient manner. To complement the automated methods, particularly in noisy areas of the slide, the user may manually identify or discard spots. Quality control views allow the user to assess systematic biases in the data.
::DEVELOPER
J. Craig Venter Institute
:: SCREENSHOTS


:: REQUIREMENTS
- Windows/Mac OS X on Intel chips/Mac OS X on PowerPC chips/Linux
:: DOWNLOAD
 Spotfinder v3.2.1 for Win ; for Mac OS X on Intel chips ; for Mac OS X on PowerPC chips ; for Linux ; Manual ; Source Code ; Training Documents
:: MORE INFORMATION
Referencing Spotfinder
Saeed AI, Sharov V, White J, Li J, Liang W, Bhagabati N, Braisted J, Klapa M, Currier T, Thiagarajan M, Sturn A, Snuffin M, Rezantsev A, Popov D, Ryltsov A, Kostukovich E, Borisovsky I, Liu Z, Vinsavich A, Trush V, Quackenbush J. TM4: a free, open-source system for microarray data management and analysis. Biotechniques. 2003 Feb;34(2):374-8.


