edgeR 3.34.0 / edgeRun 1.0.9 – Empirical analysis of digital Gene Expression data

edgeR 3.34.0 / edgeRun 1.0.9

:: DESCRIPTION

edgeR (empirical analysis of digital gene expression in R) is an R/Bioconductor software package for statistical analysis of replicated count data. Methods are designed for assessing differential expression in comparative RNA-Seq experiments, but are generally applicable to count data from other genome-scale platforms (ChIP-Seq, MeDIP-Seq, Tag-Seq, SAGE-Seq etc).

edgeRun, an R package that implements an unconditional exact test that is a more powerful version of the exact test in edgeR.

::DEVELOPER

WEHI Bioinformatics

:: SCREENSHOTS

N/A

:: REQUIREMENTS

  • Linux/ MacOsX/Windows
  • R package
  • BioConductor

:: DOWNLOAD

 edgeR , edgeRun

:: MORE INFORMATION

Citation

edgeRun: an R package for sensitive, functionally relevant differential expression discovery using an unconditional exact test.
Dimont E, Shi J, Kirchner R, Hide W.
Bioinformatics. 2015 Apr 21. pii: btv209.

Bioinformatics. 2010 Jan 1;26(1):139-40. doi: 10.1093/bioinformatics/btp616. Epub 2009 Nov 11.
edgeR: a Bioconductor package for differential expression analysis of digital gene expression data.
Robinson MD, McCarthy DJ, Smyth GK.

ArrayXPath – Biological Pathway-based analysis of Gene Expression data

ArrayXPath

:: DESCRIPTION

ArrayXPath is a web-based service for mapping and visualizing microarray gene-expression data for integrated biological pathway resources using Scalable Vector Graphics (SVG)

::DEVELOPER

SNUBI (Snubi’s Not Unics, Biomedical Informatics.)

:: SCREENSHOTS

N/A

:: REQUIREMENTS

  • Web browser

:: DOWNLOAD

 NO

:: MORE INFORMATION

Citation:

Nucleic Acids Res. 2004 Jul 1;32(Web Server issue):W460-4.
ArrayXPath: mapping and visualizing microarray gene-expression data with integrated biological pathway resources using Scalable Vector Graphics.
Chung HJ1, Kim M, Park CH, Kim J, Kim JH.

Asterias – Applications for the Analysis of Gene Expression and aCGH data

Asterias

:: DESCRIPTION

Asterias is an integrated collection of freely-accessible web tools for the analysis of gene expression and aCGH data. Asterias includes applications for the analysis of genomic (and, to a lesser extent, proteomic) data that cover from data normalization to development of prediction models for survival data. Most of our applications use parallelization (via MPI) and run on a server with 60 CPUs for computation. And most of our applications allow the user to obtain additional information about the genes (chromosomal location, PubMed ids, Gene Ontology terms, etc) by using clickable links in tables and/or figures, thus allowing for enhanced interpretability of the results.

The tools include: normalization of expression and aCGH data (DNMAD); converting between different types of gene/clone and protein identifiers (IDconverter/IDClight); filtering and imputation (preP); finding differentially expressed genes related to patient class and survival data (Pomelo II); searching for models of class prediction (Tnasas); using random forests to search for minimal models for class prediction or for large subsets of genes with predictive capacity (GeneSrF); searching for molecular signatures and predictive genes with survival data (SignS); detecting regions of genomic DNA gain or loss (ADaCGH).

::DEVELOPER

 Bioinfo Unit@CNIO

:: SCREENSHOTS

:: REQUIREMENTS

:: DOWNLOAD

  Asterias

:: MORE INFORMATION

Citation

Cancer Inform. 2007 Feb 3;3:1-9.
Asterias: a parallelized web-based suite for the analysis of expression and aCGH data.
Alibés A, Morrissey ER, Ca?ada A, Rueda OM, Casado D, Yankilevich P, Díaz-Uriarte R.

Genevestigator 8.3.2 – Gene Expression Search Engine

Genevestigator 8.3.2

:: DESCRIPTION

Genevestigator is a multi-organism microarray database and expression meta-analysis tool.Genevestigator is a high performance search engine for gene expression. Our focus is on the deep integration of high quality, well annotated data with high-performance computing. This allows users to run unique types of queries across thousands of datasets simultaneously.

::DEVELOPER

Genevestigator Team

:: SCREENSHOTS

:: REQUIREMENTS

  • Windows / Mac /  Linux
  • Java

:: DOWNLOAD

 Genevestigator

:: MORE INFORMATION

Citation

Hruz T, Laule O, Szabo G, Wessendrop F, Bleuler S, Oertle L, Widmayer P, Gruissem W and Zimmermann P (2008)
Genevestigator V3: A Reference Expression Database for the Meta-Analysis of Transcriptomes.
Adv Bioinformatics vol. 2008, Article ID 420747, 5 pages. DOI: 10.1155/2008/420747

NetworkAnalyst 1.0 – Statistical, Visual & Network-based approaches for Gene Expression Meta analysis

NetworkAnalyst 1.0

:: DESCRIPTION

NetworkAnalyst is designed to support integrative analysis of gene expression data through statistical, visual and network-based approaches.

::DEVELOPER

the Hancock Lab at The University of British Columnbia.

:: SCREENSHOTS

N/A

:: REQUIREMENTS

  • web browser

:: DOWNLOAD

 NO

:: MORE INFORMATION

Citation:

NetworkAnalyst for statistical, visual and network-based meta-analysis of gene expression data.
Xia J, Gill EE, Hancock RE.
Nat Protoc. 2015 Jun;10(6):823-44. doi: 10.1038/nprot.2015.052. Epub 2015 May 7.

GPLVM – Time-structured Gene-expression data

GPLVM

:: DESCRIPTION

GPLVM (Gaussian Process Latent Variable Models) is a novel framework to analyse single-cell qPCR expression data from differnt developmental stages.

::DEVELOPER

Institute of Computational Biology, German Research Center for Environmental Health (GmbH)

:: SCREENSHOTS

N/A

:: REQUIREMENTS

  • Windows / Linux / MacOsX
  • MatLab

:: DOWNLOAD

  GPLVM

:: MORE INFORMATION

Citation

A novel approach for resolving differences in single-cell gene expression patterns from zygote to blastocyst.
Buettner F, Theis FJ.
Bioinformatics. 2012 Sep 15;28(18):i626-i632. doi: 10.1093/bioinformatics/bts385.

TimeClust 1.3 – Clustering tool for Gene Expression Time Series

TimeClust 1.3

:: DESCRIPTION

TimeClust is a user-friendly software package to cluster genes according to their temporal expression profiles. It can be conveniently used to analyze data obtained from DNA microarray time-course experiments. It implements two original algorithms specifically designed for clustering short time series together with hierarchical clustering and self-organizing maps.

::DEVELOPER

laboratorio di Bioinformatica e Biologia Sintetica – Univ. of Pavia

:: SCREENSHOTS

N/A

:: REQUIREMENTS

  • Linux / Windows

:: DOWNLOAD

 TimeClust

:: MORE INFORMATION

Citation

Bioinformatics. 2008 Feb 1;24(3):430-2. Epub 2007 Dec 6.
TimeClust: a clustering tool for gene expression time series.
Magni P, Ferrazzi F, Sacchi L, Bellazzi R.

PADOG 1.34.0 – Gene Set Analysis using Gene Expression data

PADOG 1.34.0

:: DESCRIPTION

PADOG (Pathway Analysis with Down-weighting of Overlapping Genes) is a standard Bioconductor style R package that can be used to perform gene set analysis (e.g. pathway analysis) using microarray data.

::DEVELOPER

the Bioinformatics and Computational Biology Unit of the Perinatology Research Branch (NICHD)

:: SCREENSHOTS

N/A

:: REQUIREMENTS

  • Windows / Linux / MacOS
  • R package
  • Bioconductor

:: DOWNLOAD

  PADOG

:: MORE INFORMATION

Citation

BMC Bioinformatics. 2012 Jun 19;13:136. doi: 10.1186/1471-2105-13-136.
Down-weighting overlapping genes improves gene set analysis.
Tarca AL, Draghici S, Bhatti G, Romero R.

HeatmapGenerator 5 – Create Customized Gene Expression Heatmaps

HeatmapGenerator 5

:: DESCRIPTION

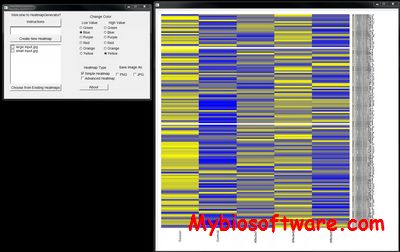
HeatmapGenerator is a graphical user interface software program written in C++, R, and OpenGL to create customized gene expression heatmaps from RNA-seq and microarray data in medical research. HeatmapGenerator can also be used to make heatmaps in a variety of other non-medical fields.

::DEVELOPER

Bohdan Khomtchouk

:: SCREENSHOTS

HeatmapGenerator

:: REQUIREMENTS

  • Windows / MacOSX

:: DOWNLOAD

 HeatmapGenerator

:: MORE INFORMATION

Citation:

HeatmapGenerator: high performance RNAseq and microarray visualization software suite to examine differential gene expression levels using an R and C++ hybrid computational pipeline.
Khomtchouk BB, Van Booven DJ, Wahlestedt C.
Source Code Biol Med. 2014 Dec 24;9(1):30. doi: 10.1186/s13029-014-0030-2.

xseq 0.2.1 – Assessing Functional Impact on Gene Expression of Mutations in Cancer

xseq 0.2.1

:: DESCRIPTION

Cancer driver mutations control outcomes indirectly through intermediate phenotypes, e.g., gene expression and protein expression. xseq is a probabilistic model which aims to encode the impact of somatic mutations on gene expression profiles.

::DEVELOPER

Shah Lab

:: SCREENSHOTS

N/A

:: REQUIREMENTS

  • Linux / MacOsX / Windows
  • R

:: DOWNLOAD

xseq

:: MORE INFORMATION

Citation

Nat Commun. 2015 Oct 5;6:8554. doi: 10.1038/ncomms9554.
Systematic analysis of somatic mutations impacting gene expression in 12 tumour types.
Ding J et al.