Gepard 1.40
:: DESCRIPTION
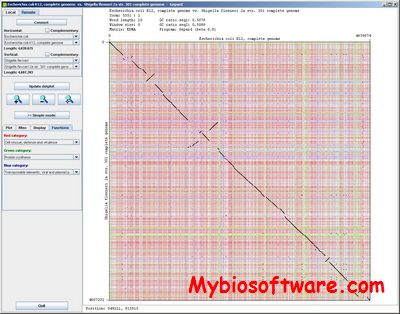
Gepard (German: “cheetah”, Backronym for “GEnome PAir – Rapid Dotter”) allows the calculation of dotplots even for large sequences like chromosomes or bacterial genomes.
::DEVELOPER
CUBE – Bioinformatics and Computational Systems Biology, University of Vienna
:: SCREENSHOTS
:: REQUIREMENTS
- Linux / Windows / MacOsX
- Java
:: DOWNLOAD
:: MORE INFORMATION
Citation
Krumsiek J, Arnold R, Rattei T.
Gepard: A rapid and sensitive tool for creating dotplots on genome scale.
Bioinformatics 2007; 23(8): 1026-8. PMID: 17309896


