MulteeSum – Visualize Comparison of Cellular Gene Expression Profiles

MulteeSum

:: DESCRIPTION

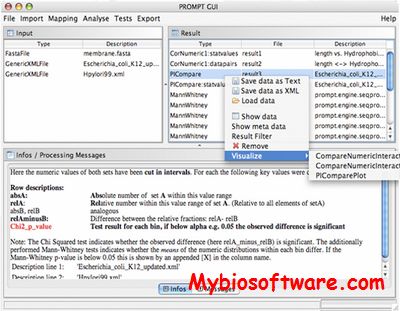
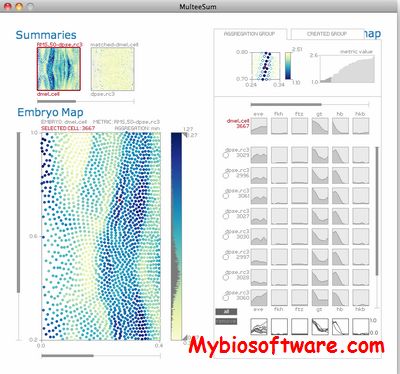
MulteeSum is a visualization system that supports inspection and curation of data sets showing gene expression over time, in conjunction with the spatial location of the cells where the genes are expressed — it is the first tool to support comparisons across multiple such datasets.

::DEVELOPER

Miriah Meyer & DePace Lab

:: SCREENSHOTS

multeesum

:: REQUIREMENTS

  • Linux/ Windows/ MacOsX

:: DOWNLOAD

 MulteeSum 

:: MORE INFORMATION

Citation:

IEEE Trans Vis Comput Graph. 2010 Nov-Dec;16(6):908-17. doi: 10.1109/TVCG.2010.137.
MulteeSum: a tool for comparative spatial and temporal gene expression data.
Meyer M, Munzner T, DePace A, Pfister H.

PROMPT 0.9.7 – Protein Mapping and Comparison Tool

PROMPT 0.9.7

:: DESCRIPTION

PROMPT is a platform independent system for retrieval, analysis, mapping and comparison of protein sets. It allows easy mapping of different types of sequence identifiers, automatical data retrieval and integration, a multitude of analysis and comparison algorithms and a full-featured easy to use graphical user interface (GUI) application with an integrated help-system.

::DEVELOPER

Willkommen am Lehrstuhl für Genomorientierte Bioinformatik der TU München.

:: SCREENSHOTS

PROMPT

:: REQUIREMENTS

  • Linux/ MacOsX / Windows
  • Java

:: DOWNLOAD

 PROMPT

:: MORE INFORMATION

Citation

Schmidt, T., Frishman, D. (2006),
PROMPT: a protein mapping and comparison tool,
BMC Bioinformatics 2006, 7:331;

SuiteMSA 1.3.22B – Visual tools for the comparison and analysis of Multiple Sequence Alignments

SuiteMSA 1.3.22B

:: DESCRIPTION

SuiteMSA is a java-based application that provides unique MSA viewers. Users can directly compare multiple MSAs and evaluate where the MSAs agree (are consistent) or disagree (are inconsistent).

::DEVELOPER

Catherine Lee Anderson

:: SCREENSHOTS

SuiteMSA

::REQUIREMENTS

  • MacOsX/Linux/Windows
  • Java

:: DOWNLOAD

 SuiteMSA

:: MORE INFORMATION

Citation

BMC Bioinformatics. 2011 May 21;12:184. doi: 10.1186/1471-2105-12-184.
SuiteMSA: visual tools for multiple sequence alignment comparison and molecular sequence simulation.
Anderson CL, Strope CL, Moriyama EN.

COMSPARI 20031215 – Comparison of Spectral and Retention Information

COMSPARI 20031215

:: DESCRIPTION

COMSPARI (COMparison of SPectral And Retention Information) is a software that has been written to facilitate the analysis of “paired” samples, i.e. samples that are almost identical yet present some qualitative difference. The software was originally written for the analysis of data files produced by GC/MS and LC/MS, but can be used for other techniques, too.

::DEVELOPER

COMSPARI Team

:: SCREENSHOTS

N/A

:: REQUIREMENTS

:: DOWNLOAD

 COMSPARI

:: MORE INFORMATION

Citation

J Am Soc Mass Spectrom. 2004 Apr;15(4):580-4.
A new technique (COMSPARI) to facilitate the identification of minor compounds in complex mixtures by GC/MS and LC/MS: tools for the visualization of matched datasets.
Katz JE, Dumlao DS, Clarke S, Hau J.

ChIPDiff – Genome-wide Comparison of Histone Modification Sites Identified by ChIP-seq

ChIPDiff

:: DESCRIPTION

ChIPDiff provides a solution for the identification of Differential Histone Modification Sites (DHMSs) by comparing two ChIP-seq libraries (L1 and L2). An HMM is employed in ChIPDiff to infer the states of histone modification changes

:: DEVELOPER

Computational & Mathematical Biology Lab @ GIS

:: SCREENSHOTS

N/A

:: REQUIREMENTS

  • Linux
  • C Compiler

:: DOWNLOAD

 ChIPDiff

:: MORE INFORMATION

Citation

An HMM approach to genome-wide identification of differential histone modification sites from ChIP-seq data.
Xu H, Wei CL, Lin F, Sung WK.
Bioinformatics. 2008 Oct 15;24(20):2344-9

GENOVA 1.00 – Genome Visualization and Analysis software for detailed Comparison of Genome Functions

GENOVA 1.00

:: DESCRIPTION

Genova is a JAVA-base software to manage, edit, visualize and store the genome sequence locally. All genes or ORFs are categorized by their function and plotted with different colours in a map. Support toolkit includes a sequence-format conversion tool and a sequence GC percent analysis/visualization tool. The software is designed for genome sequence comparisons, which has been proven to be powerful, in particular to prokaryotic genomes of close phylogenetic distances.

::DEVELOPER

the Department of Bioinformatics at the University of Würzburg

:: SCREENSHOTS

:: REQUIREMENTS

  • Windows/Linux/MacOsX
  • Java

:: DOWNLOAD

 Genova

:: MORE INFORMATION

Citation

Liang C, Wolz C, Herbert S, Bernhard J, Engelmann S, Hecker M, Götz F, Dandekar T. 2009.
GENOVA: A rapid genome visualization and functional genomics software.
Online Journal of Bioinformatics 10:201-17.

FTProd – Binding Site Comparison across Multiple Structures

FTProd

:: DESCRIPTION

This is FTProd, a plugin for VMD designed to characterize and identify cross-structural ‘hot spots’ in proteins. The program FTMAP identifies these druggable hot spots by docking a series of small molecular probes onto the protein surfaces. FTProd combines these output structures, clusters them, and displays them visually for easy comparison.

::DEVELOPER

The Amaro lab

:: SCREENSHOTS

N/A

:: REQUIREMENTS

  • Linux / MacOsX / WIndows
  • VMD

:: DOWNLOAD

FTProd

:: MORE INFORMATION

Citation

Bioinformatics. 2013 Feb 1;29(3):393-4. doi: 10.1093/bioinformatics/bts689. Epub 2012 Nov 29.
Multistructural hot spot characterization with FTProd.
Votapka L, Amaro RE.

JESAM 0.8.1 – Parallel Processing DNA Sequence Comparison and Clustering

JESAM 0.8.1

:: DESCRIPTION

JESAM is a software components to create and publish EST alignments and clusters.

::DEVELOPER

Jeremy Parsons

:: SCREENSHOTS

N/A

:: REQUIREMENTS

  • Linux / Windows / MacOsX
  • Java

:: DOWNLOAD

  JESAM

:: MORE INFORMATION

Citation

Bioinformatics. 2000 Apr;16(4):313-25.
JESAM: CORBA software components to create and publish EST alignments and clusters.
Parsons JD, Rodriguez-Tomé P.

CNViewer 2.1 – Analysis and Comparison of Copy Number Variation (CNV)

CNViewer 2.1

:: DESCRIPTION

CNViewer is a user-friendly tool for analysis and comparison of Copy Number Variation (CNV). It presents several functionalities such as add sensitive (usually clinical/phenotypic) data, export module, selection of genomic region of interest and supports three methods to input data.

::DEVELOPER

Cintia C. Palu

:: SCREENSHOTS

:: REQUIREMENTS

  • Web Browser

:: DOWNLOAD

 CNViewer

:: MORE INFORMATION

CCT – CGView Comparison Tool

CCT

:: DESCRIPTION

CCT is a package for visually comparing bacterial, plasmid, chloroplast, or mitochondrial sequences of interest to existing genomes or sequence collections. The comparisons are conducted using BLAST, and the BLAST results are presented in the form of graphical maps that can also show sequence features, gene and protein names, COG category assignments, and sequence composition characteristics. CCT can generate maps in a variety of sizes, including 400 Megapixel maps suitable for posters. Comparisons can be conducted within a particular species or genus, or all available genomes can be used. The entire map creation process, from downloading sequences to redrawing zoomed maps, can be completed easily using scripts included with the CCT. User-defined features or analysis results can be included on maps, and maps can be extensively customized.

::DEVELOPER

Paul Stothard

:: SCREENSHOTS

:: REQUIREMENTS

:: DOWNLOAD

 CCT

:: MORE INFORMATION

Citation:

Grant JR, Arantes AS, Stothard P (2012)
Comparing thousands of circular genomes using the CGView Comparison Tool.
BMC Genomics 13:202.