GGT 2.0 – Visualization & Analysis of Molecular Marker Data

GGT 2.0

:: DESCRIPTION

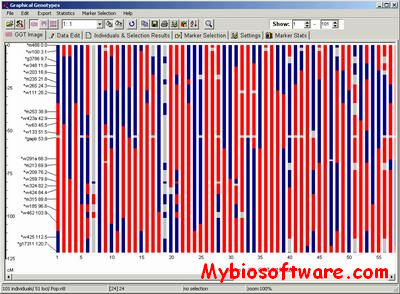
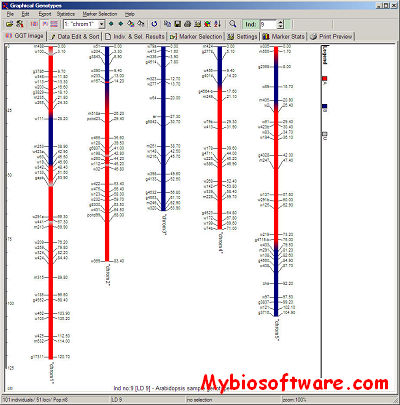
GGT stands for Graphical GenoTypes. A graphical representation of molecular marker data can be an important tool in the process of selection and evaluation of plant material. GGT was developed that enables representation of molecular marker data by simple chromosome drawings in several ways. Commonly used marker file types that contain marker information serve as input for GGT. Besides representation, GGT can also be used for a diverse range of selections and analyses.

::DEVELOPER

Wageningen UR Plant Breeding

:: SCREENSHOTS

:: REQUIREMENTS

  • Windows

:: DOWNLOAD

GGT

:: MORE INFORMATION

Citation

J Hered. 2008 Mar-Apr;99(2):232-6. doi: 10.1093/jhered/esm109. Epub 2008 Jan 24.
GGT 2.0: versatile software for visualization and analysis of genetic data.
van Berloo R.
BANANAS – Infer Population Trees based on Molecular Marker data

BANANAS

:: DESCRIPTION

BANANAS is a software for inferring population trees based on molecular marker data.

::DEVELOPER

Bayesian Statistics Group

:: SCREENSHOTS

N/A

:: REQUIREMENTS

:: DOWNLOAD

 BANANAS

:: MORE INFORMATION

Citation:

Siren, J., Marttinen, P. and Corander, J. 2011.
Reconstructing Population Histories from Single Nucleotide Polymorphism Data.
Molecular Biology and Evolution. 28:673-683.

cM Converter – Convert in Batch Physical to Genetical Map Positions of Molecular Markers of Rice

cM Converter

:: DESCRIPTION

cM Converter (centimorgan converter) is a program to convert in batch physical to genetical map positions of molecular markers of rice.

::DEVELOPER

Mathias Lorieux

:: SCREENSHOTS

N/A

:: REQUIREMENTS

  • Windows / MacOsX
  • Excel

:: DOWNLOAD

 cM Converter

:: MORE INFORMATION