GenePath – Analysis of Genetic Data and Discovery of Genetic Networks

GenePath

:: DESCRIPTION

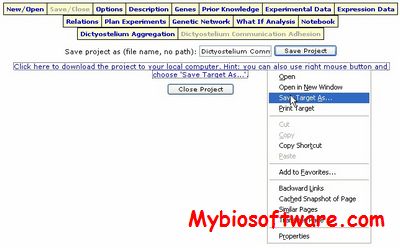
GenePath is a web-enabled intelligent assistant for the analysis of genetic data and for discovery of genetic networks.

::DEVELOPER

BioLab , University of Ljubljana

:: SCREENSHOTS

:: REQUIREMENTS

  • Any Web Browser

:: DOWNLOAD

NO

:: MORE INFORMATION

Citation:

GenePath: from mutations to genetic networks and back.
Juvan P, Demsar J, Shaulsky G, Zupan B.
Nucleic Acids Res. 2005 Jul 1;33(Web Server issue):W749-52.

SPASIBA 0.0.2 – Spatial Continuous Assignment from Genetic Data

SPASIBA 0.0.2

:: DESCRIPTION

SPASIBA is an R package for spatial continuous assignment from genetic data.

::DEVELOPER

Gilles Guillot

:: SCREENSHOTS

N/A

:: REQUIREMENTS

  • Linux
  • R

:: DOWNLOAD

 SPASIBA

:: MORE INFORMATION

Citation

Accurate continuous geographic assignment from low- to high-density SNP data.
Guillot G, Jónsson H, Hinge A, Manchih N, Orlando L.
Bioinformatics. 2015 Nov 28. pii: btv703.

SPIP 1.0 – Simulate Pedigrees and Genetic data in Age-structured Population

SPIP 1.0

:: DESCRIPTION

SPIP (simulate pedigrees in populations) simulates the transmission of genes from parents to offspring in a population having demographic structure defined by the user. Numerous variables controlling the age structure of the population, the number of offspring produced, the variance in male and female reproductive success, survival rates of different age classes, mate fidelity, duration of simulation, etc. can be specified by the user.

::DEVELOPER

Eric C. Anderson

:: SCREENSHOTS

N/A

:: REQUIREMENTS

  • Windows / Linux / MacOsX

:: DOWNLOAD

 SPIP

:: MORE INFORMATION

Citation

Anderson, E. C., and K. K. Dunham.2005.
SPIP 1.0: a program for simulating pedigrees and genetic data in age-structured populations.
Molecular Ecology Notes 5(2):459-461.

PhyloMapper 1.0 beta 1 – Estimate Phylogeographic History using Genetic Data

PhyloMapper 1.0 beta 1

:: DESCRIPTION

PhyloMapper can be used to estimate phylogeographic history using genetic data.  The statistical model implemented in PhyloMapper is unique in that it can be used as a descriptive tool and/or to test a priori hypotheses

::DEVELOPER

Lemmon Lab

:: SCREENSHOTS

N/A

:: REQUIREMENTS

  • Windows/ Linux / MacOsX
  • Java

:: DOWNLOAD

 PhyloMapper

:: MORE INFORMATION

Citation

Syst Biol. 2008 Aug;57(4):544-61. doi: 10.1080/10635150802304761.
A likelihood framework for estimating phylogeographic history on a continuous landscape.
Lemmon AR, Lemmon EM.

GDL 1.1.0 – Genetic Data analysis Library

GDL 1.1.0

:: DESCRIPTION

The GDL (Genetic Data analysis Library) is a dynamic C library that aims at providing low level and high level Application Programming Interface (API) to manage and analysis various genetic and genomic data types.

::DEVELOPER

Jean-Baptiste Veyrieras

:: SCREENSHOTS

N/A

:: REQUIREMENTS

  • Linux / MacOsX / Windows
  • C Compiler

:: DOWNLOAD

 GDL

:: MORE INFORMATION

PATRI – Paternity Analysis of Genetic Data

PATRI

:: DESCRIPTION

PATRI (PaTeRnity Inference) is a program for paternity analysis of genetic data. The program requires genotypic, diploid data from one or more loci from mother-offspring pairs and from potential fathers. Typical data might include microsatellite markers, Restriction Fragment Length Polymorphisms (RFLPs) or Single Nucleotide Polymorphisms (SNPs). Given such genotypic data, PATRI can calculate posterior probabilities of paternity for all sampled offspring. When behavioral or ecological information can be used to divide the sampled males into different groups, PATRI can perform maximum likelihood analyses of hypotheses regarding the relative reproductive success of those groups.

::DEVELOPER

the Nielsen group

:: SCREENSHOTS

N/A

:: REQUIREMENTS

  • Windows / Linux

:: DOWNLOAD

  PATRI

:: MORE INFORMATION

Citation:

Nielsen,R., Mattila,D.K., Clapham,P.J. and Palsb?ll,P.J. 2001.
Statistical Approaches to Paternity Analysis in Natural Populations and Applications to the North Atlantic Humpback Whale.
Genetics 157:1673-1682.

Structurama – Infer Population Structure from Genetic Data

Structurama 

:: DESCRIPTION

Structurama is a program for inferring population structure from genetic data. The program assumes that the sampled loci are in linkage equilibrium and that the allele frequencies for each population are drawn from a Dirichlet probability distribution. The method implements two different models for population structure. First, Structurama implements the method of Pritchard et al. (2000) in which the number of populations is considered fixed. The program also allows the number of populations to be a random variable following a Dirichlet process prior (Pella and Masuda, 2006; Huelsenbeck and Andolfatto, 2007).

::DEVELOPER

Structurama Team

:: SCREENSHOTS

N/A

:: REQUIREMENTS

  • Mac OsX / Linux

:: DOWNLOAD

 Structurama

:: MORE INFORMATION

Citation:

John P. Huelsenbeck, Peter Andolfatto, and Edna T. Huelsenbeck
Structurama: Bayesian inference of population structure
Evol Bioinform Online. 2011; 7: 55–59.

PhyNav 1.0 – Reconstruct Evolutionary Relationship among Contemporary Species based on Genetic data

PhyNav 1.0

:: DESCRIPTION

PhyNav (Phylogenetic Navigator)is a tree sampling method to reconstruct phylogenetic trees from really large datasets (DNA and protein). The method combines different methods to sample good trees.

::DEVELOPER

 the Center of Integrative Bioinformatics Vienna (CIBIV) headed by Arndt von Haeseler.

:: SCREENSHOTS

N/A

:: REQUIREMENTS

  • Linux

:: DOWNLOAD

 PhyNav

:: MORE INFORMATION

Citation:

Le Sy Vinh, Heiko A. Schmidt and Arndt von Haeseler,
PhyNav: A novel approach to reconstruct large phylogenies,
proceedings of GfKl conference, 2004.

Hickory 1.1 – Analysis of Geographic Structure in Genetic data

Hickory 1.1

:: DESCRIPTION

Hickory provided here implements the Bayesian method described in Holsinger (1999) for estimating F-statistics co-dominant marker data and the method described in Holsinger et al. (2002) for estimating F-statistics from dominant marker data. It also includes routines to allow posterior comparisons as described in Holsinger and Wallace (2004).

::DEVELOPER

Kent HolsingerPaul Lewis

:: SCREENSHOTS

N/A

:: REQUIREMENTS

  • Windows / Linux / MacOsX

:: DOWNLOAD

 Hickory

:: MORE INFORMATION

GenoPlayer 20070621 – Visualizing and Querying Genetic Data

GenoPlayer 20070621

:: DESCRIPTION

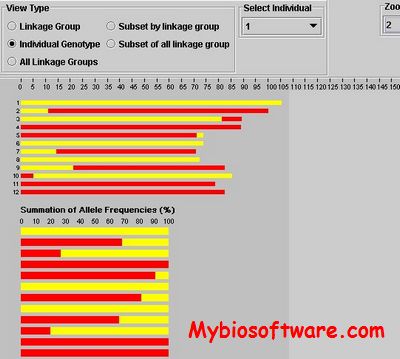
GenoPlayer is a software which is useful for visualization and manual refinement of MapPop results. Genome analysis based on molecular markers can generate large amount of information. A graphical display and visualization of the data provides a powerful overview of information and can simplify interpretation. We developed a JAVA software package, GenoPlayer, for visualizing and querying genetic linkage data. The program displays chromosomal genotypes of individuals based on molecular marker data. GenoPlayer can be used to select informative markers, to identify the most useful individuals in a segregating population, to detect segregation distortion, and to detect errors in the data.

::DEVELOPER

the Michelmore lab at UC Davis

:: SCREENSHOTS

:: REQUIREMENTS

  • Windows / Linux / MacOsX
  • Java

:: DOWNLOAD

 GenoPlayer

:: MORE INFORMATION