ENT 1.0.2 – Genotype Phasing by Entropy Minimization

ENT 1.0.2

:: DESCRIPTION

ENT is a highly scalable genotype phasing algorithm based on entropy minimization. ENT is capable of phasing both unrelated and related genotypes coming from complex pedigrees.

::DEVELOPER

Bioinformatics Lab , Computer Science & Engineering Dept. University of Connecticut

:: SCREENSHOTS

Command Line

:: REQUIREMENTS

  • Linux

:: DOWNLOAD

ENT

:: MORE INFORMATION

Citation:

A. Gusev and I.I. Mandoiu and B. Pasaniuc,
Highly Scalable Genotype Phasing by Entropy Minimization,
IEEE/ACM Trans. on Computational Biology and Bioinformatics 5, pp. 252-261, 2008

GEVALT 2.0 – Genotype Analysis

GEVALT 2.0

:: DESCRIPTION

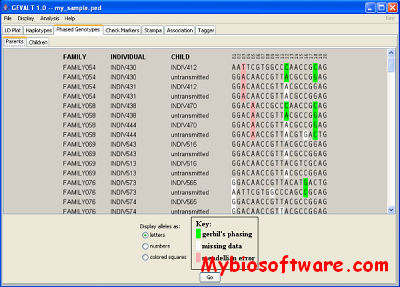
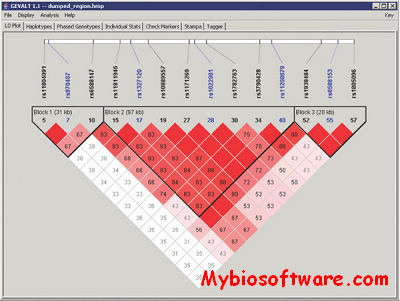
GEVALT (GEnotype Visualization and ALgorithmic Tool) is designed to simplify and expedite the process of genotype analysis and disease association tests by providing a common interface to several common tasks relating to such analyses. It is aimed for analysis of unrelated individuals as well as two-generation families.

::DEVELOPER

Prof. Ron Shamir’s Computational Genomics Laboratory at the School of Computer Science, Tel Aviv University, Israel

:: SCREENSHOTS

:: REQUIREMENTS

  • Windows / Linux / Mac OsX
  • Java

:: DOWNLOAD

GEVALT

:: MORE INFORMATION

Citation:

Ofir Davidovich, Gad Kimmel and Ron Shamir.
GEVALT: An integrated software tool for genotype analysis.
BMC Bioinformatics 2007, 8:36.

XP-CLR 1.0 – Cross-population Composite Likelihood Ratio Test

XP-CLR 1.0

:: DESCRIPTION

XP-CLR (cross-population composite likelihood ratio test) uses allele frequency differentiation at linked loci to detect selective sweeps.

::DEVELOPER

Reich laboratory

:: SCREENSHOTS

N/A

:: REQUIREMENTS

  • Linux

:: DOWNLOAD

XP-CLR

:: MORE INFORMATION

Citation:

Population differentiation as a test for selective sweeps
Hua Chen, Nick Patterson and David Reich
Genome Res. 2010. 20: 393-402 January 19, 2010, doi:10.1101/gr.100545.109

RecMin – Identify Ancestral Recombination Event

RecMin

:: DESCRIPTION

RecMin is a software to identify ancestral recombination events from population genetic data.Under certain assumptions the pattern of diversity at a collection of linked sites provides information allowing us to detect historic recombination events. The program RecMin.c calculates a lower bound on the number of recombination events required to construct any history of a sample, under the assumption that each segregating site has mutated only once since the most recent common ancestor of the sample. Such a lower bound is appropriate, since many historical recombinations are typically undetectable. It gives a measure of what extent the sample history differs from a simple tree structure, and can show if there is regional clustering of the detectable recombinations.

::DEVELOPER

Simon Myers

:: SCREENSHOTS

N/A

:: REQUIREMENTS

  • Linux / Windows / Unix

:: DOWNLOAD

RecMin for win ; for Unix ; Source Code

:: MORE INFORMATION

Citation:

Myers, S. and Griffiths, R. C.,
Bounds on the Minimum Number of Recombination Events in a Sample History
Genetics 163(1):375-394, Jan. 2003

HAPMIX v2 – Identify Ancestry Segment

HAPMIX v2

:: DESCRIPTION

HAPMIX is an application for accurately inferring chromosomal segments of distinct ancestry in admixed populations, using dense genetic data.

::DEVELOPER

Simon Myers

:: SCREENSHOTS

N/A

:: REQUIREMENTS

  • Linux

:: DOWNLOAD

HAPMIX

:: MORE INFORMATION

Citation:

Price et al.,
Sensitive Detection of Chromosomal Segments of Distinct Ancestry in Admixed Populations
PLoS Genet (2009).

ANCESTRYMAP 2.0 – Find Skews in Ancestry

ANCESTRYMAP 2.0

:: DESCRIPTION

ANCESTRYMAP finds skews in ancestry that are potentially associated with disease genes in recently mixed populations like African Americans. Admixture mapping is a method for localizing disease causing genetic variants that differ in frequency across populations. It is most advantageous to apply this approach to populations that have descended from a recent mix of two ancestral groups that have been geographically isolated for many tens of thousands of years: for example, African Americans have both West African and European American ancestry. The approach assumes that near a disease causing gene there will be enhanced ancestry from the population that has greater risk of getting the disease. Thus if one can calculate the ancestry along the genome for an admixed sample set, one could use that to identify disease causing gene variants. The figure below shows a schematic of how a disease locus would appear in an admixture scan of patients and controls.

::DEVELOPER

Reich laboratory

:: SCREENSHOTS

N/A

:: REQUIREMENTS

  • Linux / Unix

:: DOWNLOAD

ANCESTRYMAP for Linux ; for Unix

:: MORE INFORMATION

Citation:

Patterson et al. 2004
Methods for High-Density Admixture Mapping of Disease Genes
Am. J. Hum. Genet. 74:000–000, 2004

adpaper 0.2 – Fluctuation Domains in Adaptive Evolution

adpaper 0.2

:: DESCRIPTION

adpaper is an R package. The package includes the source code for simulations and R scripts . This can be used to re-run simulations with different parameter values to explore how each influences the onset of fluctuations.

::DEVELOPER

WeitzGroup@GeorgiaTech

:: SCREENSHOTS

N/A

:: REQUIREMENTS

:: DOWNLOAD

adpaper

:: MORE INFORMATION

Citation:

Boettiger, C, Dushoff J, Weitz JS.  2010.  Fluctuation domains in adaptive evolution. Theoretical Population Biology. 77:6-13

GRAMA 1.1 – Genetic Recombinant Analysis & Mapping Assistant

GRAMA 1.1

:: DESCRIPTION

GRAMA (Genetic Recombinant Analysis and Mapping Assistant) is a new tool that automates TGCE data analysis for genetic mapping purpose. Data from multiple TGCE runs are integrated and displayed in an intuitive visual format. GRAMA includes its own algorithm to detect peaks in electropherograms, and peaks detected by GRAMA are automatically compared with those of another software package for any difference that will be flagged for user inspection. Analyses of the automatically combined genetic mapping results from GRAMA reveal high accuracy with virtually zero errors. Because of the accuracy of the calls and the intuitive interface, GRAMA boosts user productivity more than two-fold relative to previous manual methods.

::DEVELOPER

Complex Computation Laboratory ,Iowa State University

:: SCREENSHOTS


:: REQUIREMENTS

  • Linux / Windows /Mac OsX
  • JAVA

:: DOWNLOAD

Registration First ; GRAMA

:: MORE INFORMATION

Citation

GRAMA: genetic mapping analysis of temperature gradient capillary electrophoresis data. Philip M. Maher, Hui-Hsien Chou, Elizabeth Hahn, Tsui-Jung Wen and Patrick S. Schnable. Theoretical and Applied Genetics Online First, April 2006. DOI: 10.1007/s00122-006-0282-6


HOTSPOTTER 1.2.1 – Identify Recombination Hotspots

HOTSPOTTER 1.2.1

:: DESCRIPTION

HOTSPOTTER is a software for identifying recombination hotspots from population SNP data.

::DEVELOPER

Matthew Stephens Lab

:: SCREENSHOTS

N/A

:: REQUIREMENTS

  • Linux / Mac OsX

:: DOWNLOAD

HOTSPOTTER

:: MORE INFORMATION

Citation

N Li and M Stephens. Modeling linkage disequilibrium and identifying recombination hotspots using single-nucleotide polymorphism data. Genetics, 165(4)2213-2233, 2003.


SCAT 1.0.2 – Smoothed & Continuous AssignmenTs

SCAT 1.0.2

:: DESCRIPTION

SCAT (Smoothed and Continuous AssignmenTs) implements a Bayesian statistical method for estimating allele frequencies and assigning samples of unknown (or known) origin across a continuous range of locations, based on genotypes collected at distinct sampling locations. In brief, the idea is to assume that allele frequencies vary smoothly in the study region, so allele frequencies are estimated at any given location using observed genotypes at near-by sampling locations, with data at the nearest sampling locations being given greatest weight.

::DEVELOPER

Matthew Stephens Lab

:: SCREENSHOTS

N/A

:: REQUIREMENTS

  • Linux / Mac OsX

:: DOWNLOAD

SCAT

:: MORE INFORMATION

Citation

S K Wasser, A M Shedlock, K Comstock, E A Ostrander, B Mutayoba, and M Stephens. Assigning African elephant DNA to geographic region of origin: applications to the ivory trade. Proc Natl Acad Sci U S A, 41:14844-14852, 2004.