RINalyzer 2.0 – Cytoscape plugin of Visualization and Analysis of Biomolecular Networks

RINalyzer 2.0

:: DESCRIPTION

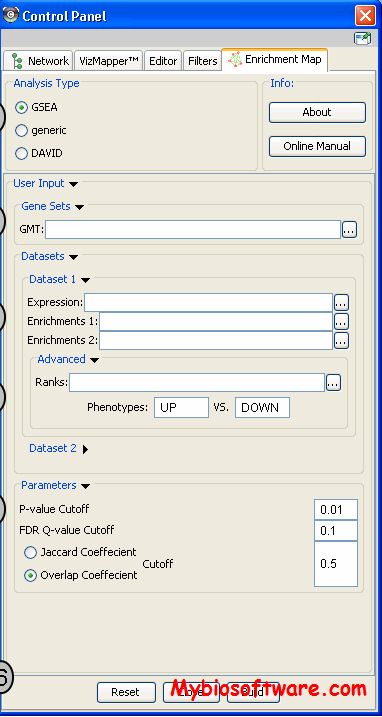
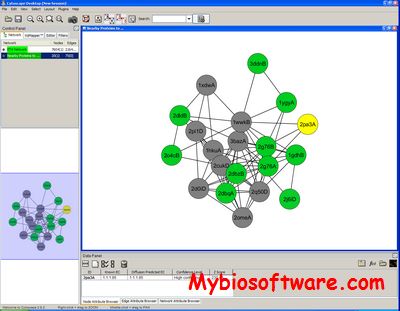
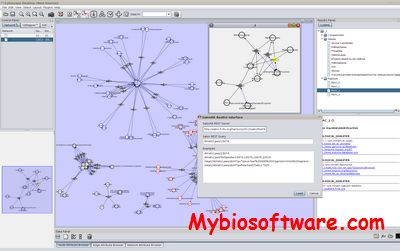
RINalyzer is a Java plugin for Cytoscape, a free open-source software platform for visualization and analysis of biomolecular networks. This plugin allows the simultaneous visualization and interactive analysis of residue interaction networks (RINs) together with the corresponding 3D protein structures displayed in UCSF Chimera. It also provides a comprehensive set of topological centrality measures to gain additional insights into the structural and functional role of interacting residues.

::DEVELOPER

RINalyzer team

:: SCREENSHOTS

:: REQUIREMENTS

:: DOWNLOAD

 RINalyzer

:: MORE INFORMATION

Citation:

Doncheva, N.T., Klein, K., Domingues, F.S., Albrecht, M. (2011):
Analyzing and visualizing residue networks of protein structures.
Trends in Biochemical Sciences, 36(4): 179-182.

NetCirChro 1.2 – Cytoscape plugin for Network Visualization on Circular Chromosomes

NetCirChro 1.2

:: DESCRIPTION

NetCirChro is a Cytoscape plugin for network visualization on circular chromosomes. The tool enable the network visualization platform Cytoscape to overlay networks onto a circular chromosomal map.

::DEVELOPER

Bioinformatics and Computational Biosciences Branch (BCBB),National Institute of Allergy and Infectious Diseases (NIAID)

:: SCREENSHOTS

:: REQUIREMENTS

:: DOWNLOAD

 NetCirChro

:: MORE INFORMATION

SimTrek 2.0 – Cytoscape plugin for Ontology-based Similarity Assessment of Biological Networks

SimTrek 2.0

:: DESCRIPTION

SimTrek is a Cytoscape plugin for ontology-based similarity assessment of biological networks.

::DEVELOPER

SimTrek team

:: SCREENSHOTS

:: REQUIREMENTS

:: DOWNLOAD

SimTrek

:: MORE INFORMATION

Citation

Wang H, Zheng H, Azuaje F (2010)
Ontology- and graph-based similarity assessment in biological networks,
Bioinformatics (2010)doi: 10.1093/bioinformatics/btq477

CyClus3D 3.3 – Cytoscape plugin for Identifying Functional Modules

CyClus3D 3.3

:: DESCRIPTION

CyClus3D is a Cytoscape plugin for identifying functional modules in integrated networks composed of multiple interaction types. CyClus3D operates by clustering user-defined 3-node network motifs.

::DEVELOPER

Van de Peer Lab

:: SCREENSHOTS

:: REQUIREMENTS

:: DOWNLOAD

 CyClus3D

:: MORE INFORMATION

Citation

Bioinformatics. 2011 Jun 1;27(11):1587-8. doi: 10.1093/bioinformatics/btr182.
CyClus3D: a Cytoscape plugin for clustering network motifs in integrated networks.
Audenaert P1, Van Parys T, Brondel F, Pickavet M, Demeester P, Van de Peer Y, Michoel T.

WordCloud 3.1.3 – Cytoscape plugin to Generate a Visual Summary of a Network

WordCloud 3.1.3

:: DESCRIPTION

The WordCloud plugin is a Cytoscape plugin that generates a visual summary of a network. It displays string attributes associated with nodes in the network as a tag cloud, where more frequent words are displayed using a larger font size. Word co-occurence in a phrase can be visualized by arranging words in clusters or as a network.

::DEVELOPER

Bader Lab

:: SCREENSHOTS

:: REQUIREMENTS

:: DOWNLOAD

 WordCloud

:: MORE INFORMATION

Citation

Source Code Biol Med. 2011 Apr 7;6:7.
WordCloud: a Cytoscape plugin to create a visual semantic summary of networks.
Oesper L, Merico D, Isserlin R, Bader GD.

MCODE 1.5.1 – Cytoscape plugin that finds Clusters in a Network

MCODE 1.5.1

:: DESCRIPTION

MCODE is a Cytoscape plugin that finds clusters (highly interconnected regions) in a network. Clusters mean different things in different types of networks. For instance, clusters in a protein-protein interaction network are often protein complexes and parts of pathways, while clusters in a protein similarity network represent protein families.

::DEVELOPER

Bader Lab

:: SCREENSHOTS

:: REQUIREMENTS

:: DOWNLOAD

 MCODE

:: MORE INFORMATION

Citation

Bader GD, Hogue CW.
An automated method for finding molecular complexes in large protein interaction networks.
BMC Bioinformatics. 2003 Jan 13;4(1):2.

Enrichment Map 3.2.1 – Cytoscape plugin for Functional Enrichment Visualization

Enrichment Map 3.2.1

:: DESCRIPTION

EnrichmentMap is a Cytoscape plugin for functional enrichment visualization. Enrichment results have to be generated outside Enrichment Map, using any of the available methods. Gene-sets, such as pathways and Gene Ontology terms, are organized into a network (i.e. the “enrichment map”). In this way, mutually overlapping gene-sets cluster together, making interpretation easier. Enrichment Map also enables the comparison of two different enrichment results in the same map.

::DEVELOPER

Bader Lab

:: SCREENSHOTS

:: REQUIREMENTS

:: DOWNLOAD

 EnrichmentMap

:: MORE INFORMATION

Citation

Merico D, Isserlin R, Stueker O, Emili A, Bader GD
Enrichment Map: A Network-Based Method for Gene-Set Enrichment Visualization and Interpretation
PLoS One. 2010 Nov 15;5(11):e13984

ETAscape – Cytoscape plugin for Predicting Protein Function based on Evolutionarily Important Structural Motifs

ETAscape

:: DESCRIPTION

The ETAscape Cytoscape plugin allows users to make predictions and visualize the basis for predictions of protein function based on evolutionarily important structural motifs.

::DEVELOPER

Lichtarge Computational Biology Lab

:: SCREENSHOTS

:: REQUIREMENTS

:: DOWNLOAD

 ETAscape

:: MORE INFORMATION

Citation:

Bioinformatics. 2012 Aug 15;28(16):2186-8. doi: 10.1093/bioinformatics/bts331. Epub 2012 Jun 11.
ETAscape: analyzing protein networks to predict enzymatic function and substrates in Cytoscape.
Bachman BJ, Venner E, Lua RC, Erdin S, Lichtarge O.

CySabioRK 0.1 – Cytoscape plugin for loading Reaction Kinetics Networks

CySabioRK 0.1

:: DESCRIPTION

 CySabioRK is an open-source Cytoscape plugin for loading reaction kinetics networks via web services from Sabio-RK.

::DEVELOPER

Matthias König

:: SCREENSHOTS

:: REQUIREMENTS

:: DOWNLOAD

 CySabioRK

:: MORE INFORMATION

SpotXplore 20100804 – Cytoscape plugin for Visual Exploration of Hotspot Expression in Gene Regulatory Networks

SpotXplore 20100804

:: DESCRIPTION

SpotXplore is a plug-in for Cytoscape which enhances the visual analysis of gene expression obtained by, e.g., microarrays or the newer RNA-seq techniques in various ways. It enables visualization of multiple conditions or time series by glyphs that encode both expression value and statistical confidence.

::DEVELOPER

Dr. Michel A. Westenberg

:: SCREENSHOTS

:: REQUIREMENTS

:: DOWNLOAD

 SpotXplore

:: MORE INFORMATION

Citation

M. A. Westenberg, J. B. T. M. Roerdink, O. P. Kuipers, S. A. F. T. van Hijum.
SpotXplore: a Cytoscape plugin for visual exploration of hotspot expression in gene regulatory networks.
Bioinformatics, 26(22):2922-2923, 2010.

Exit mobile version