structureViz – Link Visualization of Biological Networks in Cytoscape

structureViz

:: DESCRIPTION

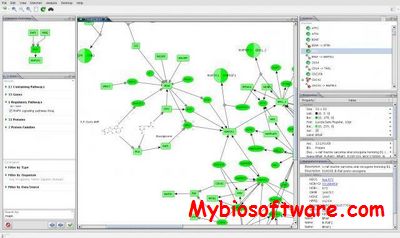
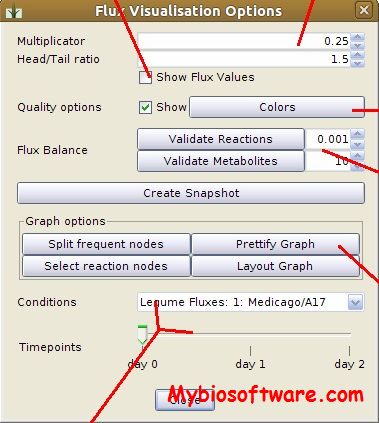
UCSF structureViz is a Cytoscape plugin that links visualization of biological networks in Cytoscape with visualization and analysis of molecular structures in UCSF Chimera.

::DEVELOPER

the Resource for Biocomputing, Visualization, and Informatics (RBVI) at UCSF

:: SCREENSHOTS

:: REQUIREMENTS

:: DOWNLOAD

structureViz

:: MORE INFORMATION

Citation:

Bioinformatics. 2007 Sep 1;23(17):2345-7. Epub 2007 Jul 10.
structureViz: linking Cytoscape and UCSF Chimera.
Morris JH1, Huang CC, Babbitt PC, Ferrin TE.

NetworkTrail 1.3 – Detection of Deregulated Pathways and Subgraphs in Biological Networks

NetworkTrail 1.3

:: DESCRIPTION

NetworkTrail is a web-interface providing access to different analysis tools for regulatory networks.

::DEVELOPER

Chair for Bioinformatics Saarbrücken

:: SCREENSHOTS

N/A

:: REQUIREMENTS

  • Web Browser

:: DOWNLOAD

 NO

:: MORE INFORMATION

Citation:

Bioinformatics. 2013 Jul 1;29(13):1702-3. doi: 10.1093/bioinformatics/btt204. Epub 2013 Apr 26.
NetworkTrail–a web service for identifying and visualizing deregulated subnetworks.
Stöckel D, Müller O, Kehl T, Gerasch A, Backes C, Rurainski A, Keller A, Kaufmann M, Lenhof HP.

BiNA 2.4.1.1 – Biological Network Analyzer

BiNA 2.4.1.1

:: DESCRIPTION

BiNA is a workbench for visualizing and analyzing biological networks. Various biological networks can be displayed, edited and analyzed.

::DEVELOPER

BiNA team

:: SCREENSHOTS

:: REQUIREMENTS

  • Windows/Linux/MacOsX
  • Java

:: DOWNLOAD

 BiNA

:: MORE INFORMATION

Citation:

BiNA: a visual analytics tool for biological network data.
Gerasch A, Faber D, Küntzer J, Niermann P, Kohlbacher O, Lenhof HP, Kaufmann M.
PLoS One. 2014 Feb 13;9(2):e87397. doi: 10.1371/journal.pone.0087397.

NetGestalt / NetSAM 1.32.0 – Integrating Multidimensional Omics data over Biological Networks

NetGestalt / NetSAM 1.32.0

:: DESCRIPTION

NetGestalt is a data integration framework that allows simultaneous presentation of large-scale experimental and annotation data from various sources in the context of a biological network to facilitate data visualization, analysis, interpretation, and hypothesis generation.

NetSAM (Network Seriation and Modularization) is an R package that takes an edge-list representation of a network as an input and generates files that can be used as an input for the one-dimensional network visualization tool NetGestalt  or other network analysis.

::DEVELOPER

the Zhang Lab

:: SCREENSHOTS

n/a

:: REQUIREMENTS

  • Windows/Linux/MacOsX
  • R
  • BioConductor

:: DOWNLOAD

 NetSAM

:: MORE INFORMATION

Citation

Nat Methods. 2013 Jul;10(7):597-8. doi: 10.1038/nmeth.2517.
NetGestalt: integrating multidimensional omics data over biological networks.
Shi Z, Wang J, Zhang B.

DDN – Identify Condition-specific Topological Changes in Biological Networks

DDN

:: DESCRIPTION

DDN (Differential Dependence Networks) is a software of analysis to detect statistically significant topological changes in the transcriptional networks between two biological conditions. We propose a local dependency model to represent the local structures of a network by a set of conditional probabilities.

::DEVELOPER

Computational Bioinformatics & Bio-imaging Laboratory (CBIL)

:: SCREENSHOTS

N/A

:: REQUIREMENTS

:: DOWNLOAD

  DDN

:: MORE INFORMATION

Citation:

Bioinformatics. 2011 Apr 1;27(7):1036-8. doi: 10.1093/bioinformatics/btr052. Epub 2011 Feb 3.
DDN: a caBIG® analytical tool for differential network analysis.
Zhang B1, Tian Y, Jin L, Li H, Shih IeM, Madhavan S, Clarke R, Hoffman EP, Xuan J, Hilakivi-Clarke L, Wang Y.

Differential dependency network analysis to identify condition-specific topological changes in biological networks.
Zhang B, Li H, Riggins RB, Zhan M, Xuan J, Zhang Z, Hoffman EP, Clarke R, Wang Y.
Bioinformatics. 2009 Feb 15;25(4):526-32. Epub 2008 Dec 26.

BNA 20060216 – Biological Network Analysis

BNA 20060216

:: DESCRIPTION

BNA contains some C++ and PERL programs that are useful for studying biological networks, especially protein interaction networks and gene coexpression networks.

::DEVELOPER

Hong Qin, Ph.D.

:: SCREENSHOTS

N/A

:: REQUIREMENTS

  • Linux
  • Perl

:: DOWNLOAD

 BNA

:: MORE INFORMATION

ClusterViz 1.0.3 – Clustering Analysis of Biological Network

ClusterViz 1.0.3

:: DESCRIPTION

ClusterViz finds clusters (highly interconnected regions, protein complexes or functional module) in a network using various clustering algorithms.

::DEVELOPER

CSU-Bioinformatics Group

:: SCREENSHOTS

N/A

:: REQUIREMENTS

  • Linux / Windows/ MacOsX
  • Java
  • Cytoscape

:: DOWNLOAD

 ClusterViz

:: MORE INFORMATION

Citation

Wang J, Zhong J, Chen G, Li M, Wu FX, and Pan Y.
ClusterViz: a Cytoscape APP for Clustering Analysis of Biological Network,
IEEE/ACM Transactions on Computational Biology and Bioinformatics, 2014, DOI 10.1109/TCBB.2014.2361348.

Hyperscape – Visualization for Complex Biological Network

Hyperscape

:: DESCRIPTION

Hyperscape is a web server of visualization for complex biological networks.

::DEVELOPER

Parkinson lab

:: SCREENSHOTS

N/A

:: REQUIREMENTS

  • Web browser

:: DOWNLOAD

 NO

:: MORE INFORMATION

Citation

Hyperscape: Visualization for complex biological networks.
Cromar GL, Zhao A, Yang A, Parkinson J.
Bioinformatics. 2015 Jun 24. pii: btv385.

BiNoM 2.5 – Cytoscape plug-in for Manipulating and Analysing biological networks

BiNoM 2.5

:: DESCRIPTION

BiNoM (Biological Network Manager )is a Cytoscape plugin, developed to facilitate the manipulation of biological networks represented in standard systems biology formats (SBML, SBGN, BioPAX) and to carry out studies on the network structure. BiNoM provides the user with a complete interface for the analysis of biological networks in Cytoscape environment.

::DEVELOPER

Computational Systems Biology of Cancer group in Bioinformatics Laboratory of Institut Curie (Paris).

:: SCREENSHOTS

:: REQUIREMENTS

:: DOWNLOAD

 BiNoM

:: MORE INFORMATION

Citation:

BiNoM 2.0, a Cytoscape plugin for accessing and analyzing pathways using standard systems biology formats.
Bonnet E, Calzone L, Rovera D, Stoll G, Barillot E, Zinovyev A.
BMC Syst Biol. 2013 Mar 1;7:18. doi: 10.1186/1752-0509-7-18.

Zinovyev A., Viara E., Calzone L., Barillot E.
BiNoM: a Cytoscape plugin for manipulating and analyzing biological networks. 2008.
Bioinformatics 24(6):876-877

FluxMap 1.15 – Visual Exploration of Flux Distributions in Biological Networks

FluxMap 1.15

:: DESCRIPTION

FluxMap is an easy to use tool for the advanced visualization of simulated or measured flux data in biological networks. Flux data import is achieved via a structured template basing on intuitive reaction equations. Flux data is mapped onto any network and visualized using edge thickness. Various visualization options and interaction possibilities enable comparison and visual analysis of complex experimental setups in an interactive way.

::DEVELOPER

FluxMap Team

:: SCREENSHOTS

:: REQUIREMENTS

:: DOWNLOAD

 FluxMap

:: MORE INFORMATION

Citation

FluxMap: a VANTED add-on for the visual exploration of flux distributions in biological networks.
Rohn H, Hartmann A, Junker A, Junker BH, Schreiber F.
BMC Syst Biol. 2012 May 1;6:33. doi: 10.1186/1752-0509-6-33.

Exit mobile version