rNAV 2.0
:: DESCRIPTION
rNAV (for rna NAVigator), is a major evolution of rNAV, a tool for the visual exploration and analysis of bacterial sRNA-mediated regulatory networks. rNAV has been designed to help bioinformaticians and biologists to identify, from lists of thousands of predictions, pertinent and reasonable sRNA target candidates for carrying out experimental validations.
::DEVELOPER
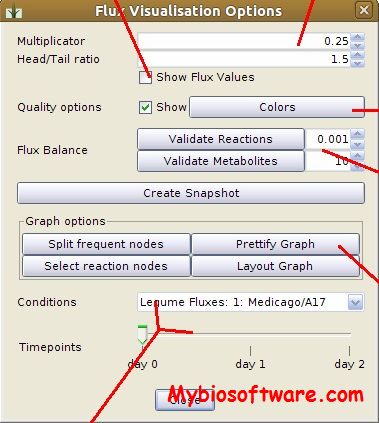
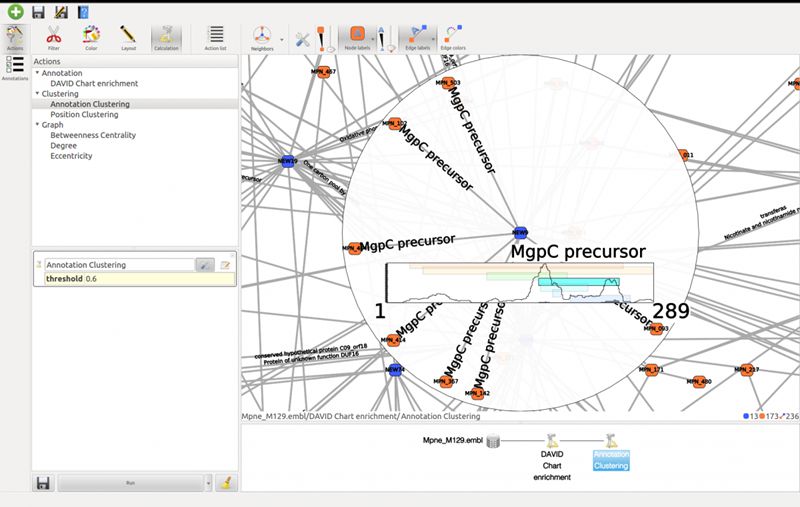
:: SCREENSHOTS

:: REQUIREMENTS
- Linux/Windows
- Tulip
:: DOWNLOAD

:: MORE INFORMATION
Citation
Bourqui R, Dutour I, Dubois J, Benchimol W, Thébault P.
rNAV 2.0: a visualization tool for bacterial sRNA-mediated regulatory networks mining.
BMC Bioinformatics. 2017 Mar 23;18(1):188. doi: 10.1186/s12859-017-1598-8. PMID: 28335718; PMCID: PMC5364647.