mDraw 1.0
:: DESCRIPTION
mDraw is a universal, generic visualization system for automatic generation of highquality drawings of directed networks.
::DEVELOPER
:: SCREENSHOTS

:: REQUIREMENTS
- Windows
:: DOWNLOAD

:: MORE INFORMATION
:: DESCRIPTION
mDraw is a universal, generic visualization system for automatic generation of highquality drawings of directed networks.
::DEVELOPER
:: SCREENSHOTS
:: REQUIREMENTS
:: DOWNLOAD
:: MORE INFORMATION
:: DESCRIPTION
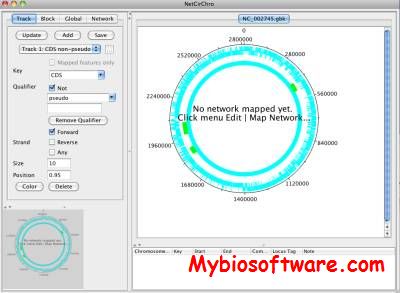
NetCirChro is a Cytoscape plugin for network visualization on circular chromosomes. The tool enable the network visualization platform Cytoscape to overlay networks onto a circular chromosomal map.
::DEVELOPER
Bioinformatics and Computational Biosciences Branch (BCBB),National Institute of Allergy and Infectious Diseases (NIAID)
:: SCREENSHOTS
:: REQUIREMENTS
:: DOWNLOAD
:: MORE INFORMATION
:: DESCRIPTION
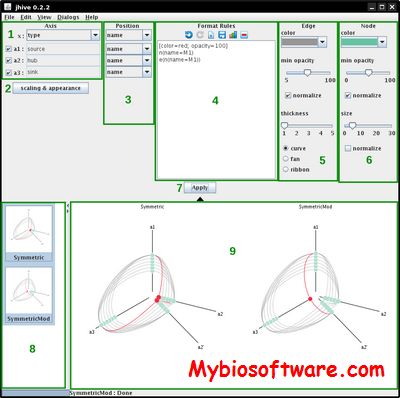
Hive plots is a scalable, computationally fast, and straight-forward network visualization method that makes possible visual interpretation of network structure and evolution.
JHIVE is a cross-platform interactive hive plot Java application.
::DEVELOPER
Canada’s Michael Smith Genome Sciences Centre
:: SCREENSHOTS
:: REQUIREMENTS
:: DOWNLOAD
:: MORE INFORMATION
Citation
Brief Bioinform. 2012 Sep;13(5):627-44. doi: 10.1093/bib/bbr069. Epub 2011 Dec 9.
Hive plots–rational approach to visualizing networks.
Krzywinski M1, Birol I, Jones SJ, Marra MA.
:: DESCRIPTION
Network2Canvas (N2C) is a web application that provides an alternative way to view networks. N2C visualizes networks by placing nodes on a square toroidal canvas.
::DEVELOPER
:: SCREENSHOTS
N/A
:: REQUIREMENTS
:: DOWNLOAD
![]()
:: MORE INFORMATION
Citation
Bioinformatics. 2013 Aug 1;29(15):1872-8. doi: 10.1093/bioinformatics/btt319. Epub 2013 Jun 7.
Network2Canvas: network visualization on a canvas with enrichment analysis.
Tan CM1, Chen EY, Dannenfelser R, Clark NR, Ma’ayan A.
:: DESCRIPTION
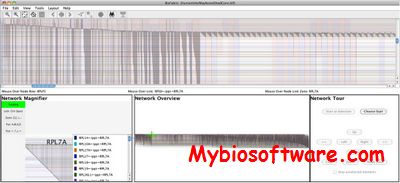
BioFabric is a network visualization tool that uses a novel presentation method where nodes are represented using horizontal line segments.
::DEVELOPER
:: SCREENSHOTS
:: REQUIREMENTS
:: DOWNLOAD
:: MORE INFORMATION
Citation:
Longabaugh, W.J.R.
Combing the hairball with BioFabric: a new approach for visualization of large networks.
BMC Bioinformatics, 13:275, 2012.
