CLUMPHAP 1.1 – Haplotype-based Association Analysis

CLUMPHAP 1.1

:: DESCRIPTION

CLUMPHAP implements a novel method for association testing based on clustering similar haplotypes (Knight et al. Submitted). This represents an extension of the basic methodology used in CLUMP, a program designed for the analysis of multi-allelic markers (Sham and Curtis 1995). CLUMPHAP calculates chi-squared statistics for binary partitions of haplotypes, where the number of partitions is reduced by allowing only those that are supported by a hierarchical cluster analysis of the haplotypes. CLUMPHAP obtains the empirical significance level of the largest chi-square statistic by a permutation procedure in which multiple permuted datasets (where the case-control labels have been randomly re-assigned) are subjected to exactly the same procedure of haplotype partitioning and calculation of largest chi-square statistic. Incidentally, this permutation procedure accounts for not only the inflation of the test statistic due to the maximization over the multiple ways of partitioning the haplotypes, but also for the uncertainty in haplotype phase of the individual subjects (Curtis and Sham 2006). The results are easy to interpret, a significant result suggests that a disease causing variant is present on haplotypes in the group which has an increased overall frequency in cases. CLUMPHAP reports the cluster pattern that resulted in the highest chi-squared along with the corresponding statistic and the empirical p-value.

::DEVELOPER

Dave Curtis

:: SCREENSHOTS

Command Line

:: REQUIREMENTS

  • Windows

:: DOWNLOAD

CLUMPHAP

:: MORE INFORMATION

Citation:

Knight J, Curtis D, Sham PC (submitted)
CLUMPHAP: A simple tool for performing haplotype-based association analysis.
Genet Epidemiol. 2008 Sep;32(6):539-45.
MetaboliteDetector 3.3 – Deconvolution and Analysis of GC/MS Data

MetaboliteDetector 3.3

:: DESCRIPTION

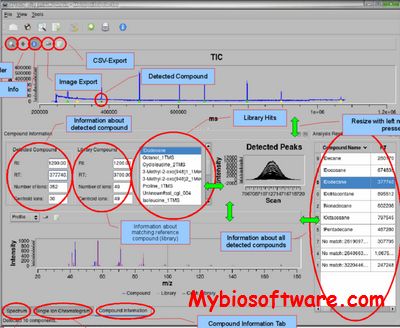
Metabolite Detector is a QT4 based software package for the analysis of GC-MS based metabolomics data. The software is especially intended for the analysis of high resoluted GC-MS chromatograms which accumulate during high throughput based metabolmics experiments.

::DEVELOPER

MetaboliteDetector Team

:: SCREENSHOTS

MetaboliteDetector

:: REQUIREMENTS

  • Linux/ Windows 

:: DOWNLOAD

 MetaboliteDetector

:: MORE INFORMATION

Citation

Anal Chem. 2009 May 1;81(9):3429-39. doi: 10.1021/ac802689c.
MetaboliteDetector: comprehensive analysis tool for targeted and nontargeted GC/MS based metabolome analysis.
Hiller K, Hangebrauk J, J?ger C, Spura J, Schreiber K, Schomburg D.

dmGWAS 3.0 – Genome-wide Association Studies (GWAS) Analysis

dmGWAS 3.0

:: DESCRIPTION

dmGWAS is designed to identify significant protein-protein interaction (PPI) modules and, from which, the candidate genes for complex diseases by an integrative analysis of GWAS dataset(s) and PPI network.

::DEVELOPER

Bioinformatics and Systems Medicine Laboratory

:: SCREENSHOTS

N/A

:: REQUIREMENTS

:: DOWNLOAD

 dmGWAS

:: MORE INFORMATION

Citation:

EW_dmGWAS: Edge-weighted dense module search for genome-wide association studies and gene expression profiles.
Wang Q, Yu H, Zhao Z, Jia P.
Bioinformatics. 2015 Mar 24. pii: btv150.

Jia P, Zheng S, Long J, Zheng W, and Zhao Z (2011)
dmGWAS: dense module searching for genome-wide association studies in protein-protein interaction networks.
Bioinformatics 27(1):95-102

LinRegPCR 20210614 – Analysis of Quantitative PCR Data

LinRegPCR 20210614

:: DESCRIPTION

LinRegPCR is a program for the analysis of quantitative RT-PCR (qPCR) data resulting from monitoring the PCR reaction with SYBR green or similar fluorescent dyes. The program determines a baseline fluorescence and does a baseline subtraction. Then a Window-of-Linearity is set and PCR efficiencies per sample are calculated. With the mean PCR efficiency per amplicon, the Ct value per sample and the fluorescence threshold set to determnine the Ct, the starting concentration per sample, expressed in arbitrary fluorescence units, is calculated

::DEVELOPER

J. M. Ruijter, S. van der Velden,A. Ilgun @ Heart Failure Research Center (HFRC)

:: SCREENSHOTS

:: REQUIREMENTS

  • Windows
  • Microsoft Excel

:: DOWNLOAD

 LinRegPCR

:: MORE INFORMATION

Citation

Ramakers C, Ruijter JM, Deprez RH, Moorman AF. (2003)
Assumption-free analysis of quantitative real-time PCR data
Neurosci Lett 2003 Mar 13;339(1): 62-66

SWAPSC 1.0 – Sliding Windows Analysis Procedure to detect Selective Constraints in Protein-coding Genes

SWAPSC 1.0

:: DESCRIPTION

SWAPSC is the software of the Sliding Window Analysis Procedure to detect Selective Constraints in protein-coding genes. The program estimates rates of nucleotide substitutions at specific codon regions in each branch of a phylogenetic tree. The program uses several sets of simulated sequence alignments to estimate the probability of synonymous and non-synonymous nucleotide substitutions. Thereafter, a statistical analysis is conducted to determine the optimum window size to detect selective constraints. Finally, the optimum window size is slid along the real alignment and a test for significance of the estimated number of synonymous and non-synonymous nucleotide substitutions in each sliding step is conducted.

::DEVELOPER

Dr Mario Fares 

:: SCREENSHOTS

N/A

:: REQUIREMENTS

  • Linux / Windows

:: DOWNLOAD

 SWAPSC

:: MORE INFORMATION

Citation

Bioinformatics. 2004 Nov 1;20(16):2867-8. Epub 2004 May 6.
SWAPSC: sliding window analysis procedure to detect selective constraints.
Fares MA.

CAPS 2.0 – Coevolution Analysis using Protein Sequences

CAPS 2.0

:: DESCRIPTION

CAPS (Coevolution Analysis using Protein Sequences) is a PERL based software that identifies co-evolution between amino acid sites. Blosum-corrected amino acid distances are used to identify amino acid co-variation. The phylogenetic sequence relationships are used to remove the phylogenetic and stochastic dependencies between sites. The 3D protein structure is used to identify the nature of the dependencies between co-evolving amino acid sites.

CAPS Online Version

::DEVELOPER

Dr Mario Fares 

:: SCREENSHOTS

N/A

:: REQUIREMENTS

  • Linux / Windows / MacOsX
  • Perl

:: DOWNLOAD

 CAPS

:: MORE INFORMATION

Citation

CAPS: coevolution analysis using protein sequences.
Fares MA, McNally D.
Bioinformatics. 2006 Nov 15;22(22):2821-2. Epub 2006 Sep 27.

RINalyzer 2.0 – Cytoscape plugin of Visualization and Analysis of Biomolecular Networks

RINalyzer 2.0

:: DESCRIPTION

RINalyzer is a Java plugin for Cytoscape, a free open-source software platform for visualization and analysis of biomolecular networks. This plugin allows the simultaneous visualization and interactive analysis of residue interaction networks (RINs) together with the corresponding 3D protein structures displayed in UCSF Chimera. It also provides a comprehensive set of topological centrality measures to gain additional insights into the structural and functional role of interacting residues.

::DEVELOPER

RINalyzer team

:: SCREENSHOTS

:: REQUIREMENTS

:: DOWNLOAD

 RINalyzer

:: MORE INFORMATION

Citation:

Doncheva, N.T., Klein, K., Domingues, F.S., Albrecht, M. (2011):
Analyzing and visualizing residue networks of protein structures.
Trends in Biochemical Sciences, 36(4): 179-182.

BNA 20060216 – Biological Network Analysis

BNA 20060216

:: DESCRIPTION

BNA contains some C++ and PERL programs that are useful for studying biological networks, especially protein interaction networks and gene coexpression networks.

::DEVELOPER

Hong Qin, Ph.D.

:: SCREENSHOTS

N/A

:: REQUIREMENTS

  • Linux
  • Perl

:: DOWNLOAD

 BNA

:: MORE INFORMATION

AMEBA 1.0 – Advanced MEtabolic Branchpoint Analysis

AMEBA 1.0

:: DESCRIPTION

AMEBA is a software of branch point analysis based on metano.

::DEVELOPER

AMEBA team

:: SCREENSHOTS

:: REQUIREMENTS

  • Linux/ Windows / MacOsX
  • Python
  • metano

:: DOWNLOAD

 AMEBA

:: MORE INFORMATION

Citation

Riemer SA, Rex R, Schomburg D.
A metabolite-centric view on flux distributions in genome-scale metabolic models.
BMC Syst Biol, 7:33 (2013).

GGEA / EnrichmentBrowser 2.22.2 – Gene Graph Enrichment Analysis

GGEA / EnrichmentBrowser 2.22.2

:: DESCRIPTION

GGEA is an intuitive method to detect consistently and coherently enriched gene sets, based on prior knowledge derived from directed gene regulatory networks. GGEA comes embedded in the EnrichmentBrowser system, a powerful multi-functional framework for enrichment analysis of gene expression data.

::DEVELOPER

Institute for Bioinformatics, Ludwig-Maximilians-Universität München

:: SCREENSHOTS

N/A

:: REQUIREMENTS

  • Linux/ MacOsX
  • R package

:: DOWNLOAD

 GGEA

:: MORE INFORMATION

Citation

Bioinformatics. 2011 Jul 1;27(13):i366-73. doi: 10.1093/bioinformatics/btr228.
From sets to graphs: towards a realistic enrichment analysis of transcriptomic systems.
Geistlinger L, Csaba G, Küffner R, Mulder N, Zimmer R.

Exit mobile version