EDISA 1.0 – Extracting Biclusters from multiple Time-series of Gene Expression Profiles

EDISA 1.0

:: DESCRIPTION

EDISA (Extended Dimension Iterative Signature Algorithm) is a novel probabilistic clustering approach for 3D gene-condition-time datasets. Based on mathematical definitions of gene expression modules, the EDISA samples initial modules from the dataset which are then refined by removing genes and conditions until they comply with the module definition. A subsequent extension step ensures gene and condition maximality. We applied the algorithm to a synthetic dataset and were able to successfully recover the implanted modules over a range of background noise intensities.

EDISA Online Version

::DEVELOPER

the Center for Bioinformatics Tübingen (Zentrum für Bioinformatik Tübingen, ZBIT).
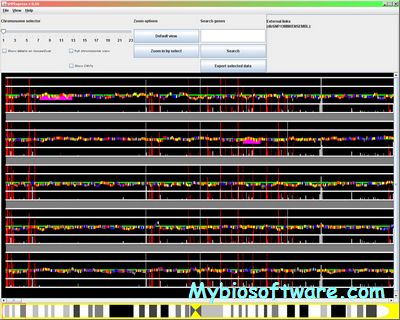
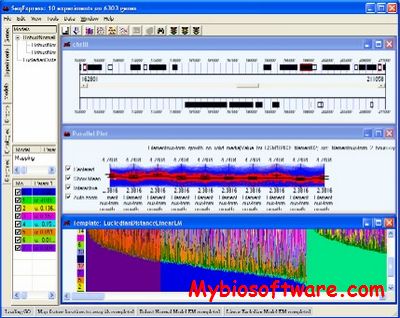
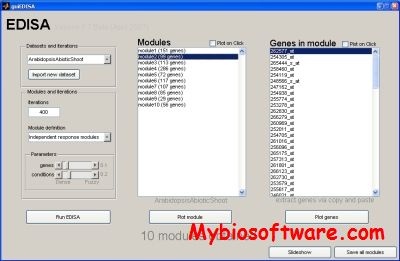
:: SCREENSHOTS

EDISA

:: REQUIREMENTS

  • Linux/ WIndows
  • Matlab

:: DOWNLOAD

  EDISA

:: MORE INFORMATION

Citation

Jochen Supper, Martin Strauch, Dierk Wanke, Klaus Harter, Andreas Zell:
EDISA: extracting biclusters from multiple time-series of gene expression profiles
BMC Bioinformatics 2007, 8:334

GETM 20100519 – Gene Expression Text Miner

GETM 20100519

:: DESCRIPTION

GETM is a tool which is capable of extracting information about the expression of genes from biomedical literature. Using the data extracted by GETM, it is possible to get an overview of the cell types that are discussed in context with gene expression of a particular gene , and vice versa.

::DEVELOPER

the Bergman lab

:: SCREENSHOTS

N/A

:: REQUIREMENTS

  • Linux / Windows / MacOsX
  • Java

:: DOWNLOAD

 GETM

:: MORE INFORMATION

Citation

Gerner M., Nenadic, G. and Bergman, C. M. (2010)
An exploration of mining gene expression mentions and their anatomical locations from biomedical text.
BioNLP ’10 Proceedings of the 2010 Workshop on Biomedical Natural Language Processing.

SNPExpress – Visualization of Gene Expression, DNA copy number and Genotype data

SNPExpress

:: DESCRIPTION

SNPExpress is a tool to combine visualization of gene expression, DNA copy number and genotype data.

::DEVELOPER

 The Department of Hematology, Erasmus University Medical Center, Rotterdam, The Netherlands

:: SCREENSHOTS

:: REQUIREMENTS

  • Linux / Windows / MacOsX
  • Java

:: DOWNLOAD

 SNPExpress

:: MORE INFORMATION

Citation

BMC Genomics. 2008 Jan 25;9:41.
SNPExpress: integrated visualization of genome-wide genotypes, copy numbers and gene expression levels.
Sanders MA, Verhaak RG, Geertsma-Kleinekoort WM, Abbas S, Horsman S, van der Spek PJ, Löwenberg B, Valk PJ.

Bimax – Systematic Comparison and Evaluation of Biclustering Methods for Gene Expression Data

Bimax

:: DESCRIPTION

 Bimax is asystematic comparison and evaluation of biclustering methods for gene expression data.

::DEVELOPER

 the Systems Optimization Group, Institut TIK, ETH Zürich

:: SCREENSHOTS

N/A

:: REQUIREMENTS

  • Linux
:: DOWNLOAD

 Bimax

:: MORE INFORMATION

Citation

A. Prelic, S. Bleuler, P. Zimmermann, A. Wille, P. Bühlmann, W. Gruissem, L. Hennig, L. Thiele, and E. Zitzler.
A Systematic Comparison and Evaluation of Biclustering Methods for Gene Expression Data.
Bioinformatics, 22(9):1122–1129, 2006.

GeneExplorer 2.1.0 – Simulation of Gene Expression

GeneExplorer 2.1.0

:: DESCRIPTION

GeneExplorer is an interactive simulation of gene expression that allows the user to:

Explore a sample gene:
Explore the correspondence between DNA, pre-mRNA, mature mRNA, and protein
Map the functional elements of a gene.
Create mutations in a gene and explore their effects.
Design a gene of their own and see how it is expressed.

::DEVELOPER

Brian White

:: SCREENSHOTS

:: REQUIREMENTS

  • Windows / Linux / MacOSX
  • Java

:: DOWNLOAD

GeneExplorer

:: MORE INFORMATION

VAMPIRE – Interpret Microarray Gene Expression Data

VAMPIRE

:: DESCRIPTION

VAMPIRE (variance-modeled posterior inference with regional exponentials) was originally developed to interpret one-channel microarray data, such as Affymetrix oligonucleotide arrays. Given a summary measure of gene expression, such as the Affymetrix MAS 5.0 scores for each microarray feature (or probe set), it determines the optimal variance model parameters for a two-component variance model. The expression-independent variance represents a constant “background” noise that affects all array features to the same extent, while the expression-dependent variance represents a proportional noise that increases with gene expression. Low-intensity features thus have larger proportional of noise, because of the influence of expression-independent variance. With this optimized model, VAMPIRE then computes a Bayesian statistical test to determine whether observed changes in intensity are statistically significant.

::DEVELOPER

Subramaniam Lab

:: SCREENSHOTS

N/A

:: REQUIREMENTS

  • Linux / Windows /MacOsX
  • Java

:: DOWNLOAD

 VAMPIRE

:: MORE INFORMATION

Citation

Albert Hsiao, Trey Ideker, Jerrold M. Olefsky and Shankar Subramaniam
VAMPIRE microarray suite: a web-based platform for the interpretation of gene expression data
Nucleic Acids Research 33 (suppl 2): W627-W632.

BTW 1.0 – Web Server for Gene Expression Time series Boltzmann Time Warping

BTW 1.0

:: DESCRIPTION

The BTW (Boltzmann Time Warping) web server allows a user to upload two tab-separated text files A,B of gene expression data, each possibly having a different number of time intervals of different durations. BTW then computes time warping distance between each gene of A with each gene of B, using a recently developed symmetric algorithm which additionally computes the Boltzmann partition function and outputs Boltzmann pair probabilities.

:: DEVELOPER

Clote Lab

:: SCREENSHOTS

N/A

:: REQUIREMENTS

  • Windows / Linux / MacOsX
  • Python

:: DOWNLOAD

 BTW

:: MORE INFORMATION

Citation

Nucleic Acids Res. 2006 Jul 1;34(Web Server issue):W482-5.
BTW: a web server for Boltzmann time warping of gene expression time series.
Ferrè F, Clote P.

MVQueries – Classify Short Gene Expression Time-courses

MVQueries

:: DESCRIPTION

MVQueries is a software of classifying short gene expression time-courses. Short gene expression time-courses monitoring response to toxins are represented as piecewise constant functions, which are modeled as left–right Hidden Markov Models. Our software implements a Bayesian approach to parameter estimation and in inference. Compared to previously published work, we improve prediction accuracy by 7 and 4%, respectively, when classifying toxicology and stress response data and e also reduce running times by at least a factor of 140.

::DEVELOPER

Alexander Schliep’s group for bioinformatics

:: SCREENSHOTS

N/A

:: REQUIREMENTS

:: DOWNLOAD

  MVQueries

:: MORE INFORMATION

Citation

Bioinformatics. 2011 Apr 1;27(7):946-52. Epub 2011 Jan 25.
Classifying short gene expression time-courses with Bayesian estimation of piecewise constant functions.
Hafemeister C, Costa IG, Sch?nhuth A, Schliep A.


GQL 1.0 – GHMM-based tool for Querying and Clustering Gene-Expression time-course data

GQL 1.0

:: DESCRIPTION

GQL (Graphical Query Language) is a suite of tools for analyizing time-course experiments. Currently, it is adapted to gene expression data. The two main tools are GQLQuery, for querying data sets, and GQLCluster, which provides a way for computing groupings based on a number of methods (model-based clustering using HMMs as cluster models and estimation of a mixture of HMMs).

::DEVELOPER

Alexander Schliep’s group for bioinformatics

:: SCREENSHOTS

N/A

:: REQUIREMENTS

:: DOWNLOAD

 GQL

:: MORE INFORMATION

Citation

Bioinformatics. 2005 May 15;21(10):2544-5. Epub 2005 Feb 8.
The Graphical Query Language: a tool for analysis of gene expression time-courses.
Costa IG, Schönhuth A, Schliep A.

SeqExpress 1.3.2 – Analysis and Desktop Visualisation program for Gene Expression Experiments

SeqExpress 1.3.2

:: DESCRIPTION

SeqExpress is a comprehensive analysis and visualisation package for gene expression experiments. GO is used to assign functional enrichment scores to clusters, using a combination of specially developed techniques and general statistical methods. These results can be explored using the in built ontology browsing tool or through the generated web pages. SeqExpress also supports numerous data transformation, projection, visualisation, file export/import, searching, integration (with R), and clustering options.

::DEVELOPER

John Boyle

:: SCREENSHOTS

:: REQUIREMENTS

  • Linux / Windows

:: DOWNLOAD

 SeqExpress

:: MORE INFORMATION

Citation

SeqExpress: desktop analysis and visualization tool for gene expression experiments.
Boyle J.
Bioinformatics. 2004 Jul 10;20(10):1649-50. Epub 2004 Feb 26.


Exit mobile version