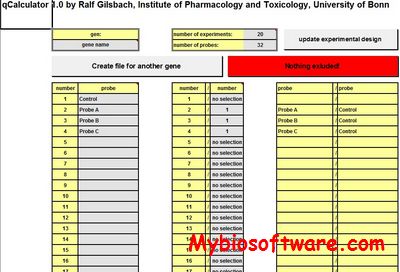
ProbePlus is an analytical tool for analyzing Affymetrix GeneChip® Gene Expression Array data at probe level. It is able to extract CEL file; integrate Perfect Match (PM) and Mis-match (MM) for a probe pair; generate gene expression index (GEI) from the integrated probe intensities of multiple probe pairs in a probe set; and analyze data directly from probe level data without necessity of generating a GEI for a probe set.
XPN is a cross-platform normalization method for combining gene expression data from different studies. Merging two gene-expression studies via cross-platform normalization.
TRANS-MNET (transcriptional module Network) performs State Space Model to time-course microarray data. State Space Model is a statistical model for analyzing time-series data and state space model implemented in TRANS-MNET is optimized for microarray data. The typical microarray time-course data is high dimensional, but has few time-points, TRANS-MNET can use replicated time-courses includes biological and technical replicates. Also, parameter constraint imposed in TRANS-MNET yields the first-order autoregressive representation of state space models that can be viewed as a parsimonius parameterization of vector AR(1). The permutation test can be applied for finding significance of its AR coefficient and this achives gene regulatory networks.
SAGAT (SVD Augmented Gene expression Analysis Tool)is an R package enabling the integration of currently existing microarray data from repositories like NCBI’s Gene Expression Omnibus (GEO) with microarray data querying conditions of interest. The goal of this integration is to better identify differentially expressed genes in the query conditions
FCAnalysis is the first package contains the R code for extracting fundamental components as well as for analyzing new datasets in terms of the human fundamental components we identified. The second package contains lists of genes in the dominant modules for our 423 human fundamental components.
ENIGMA – Expression Network Inference and Global Module Analysis. It is a software tool to analyze the modular structure of perturbational gene expression data, based on the use of combinatorial statistics and graph-based clustering. The modules are further characterized by incorporating other data types, e.g. GO annotation, protein interactions and transcription factor binding information, and by suggesting regulators that might have an effect on the expression of (some of) the genes in the module.
Steven Maere, Patrick Van Dijck, Martin Kuiper (2008) Extracting expression modules from perturbational gene expression compendia. BMC Systems Biology 2:33 (PubMed, BMC)
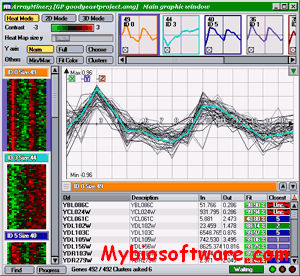
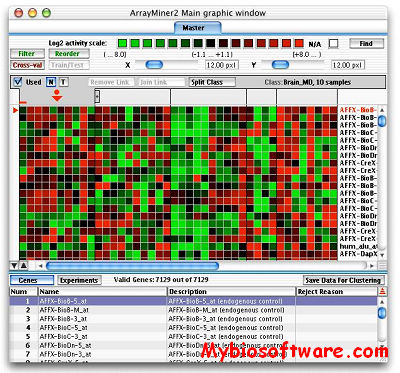
ArrayMiner® is a set of analysis tools using advanced algorithms to reveal the true structure of your gene expression data. Its unique graphical interface gives you an intimate understanding of the analysis and an easy publishing of its results.
ArrayMiner include clustering module & classmarking module.
In order to be eligible for the free light version, your institution must be academic. The light version is limited to 500 genes and 10 experiments for the clustering module and 500 genes for the ClassMarker tool. The light licence’s validity is 1 year.
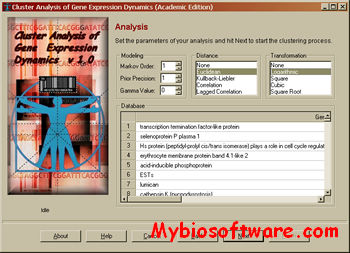
CAGED (Cluster Analysis of Gene Expression Dynamics) is a model based,Bayesian clustering procedure developed by Ramoni et al. to cluster gene expression profiles measured with microarrays in temporal experiments. Contrary to popular clustering methods, CAGED takes into account explicitly the fact that expression profiles in temporal experiments may be serially correlated and uses a model-based, Bayesian procedure to identify the best grouping of the gene expression data in an automated way.
CAGED implements a Bayesian clustering method designed to handle temporal experiments and subsuming standard independent experiments as a special case.
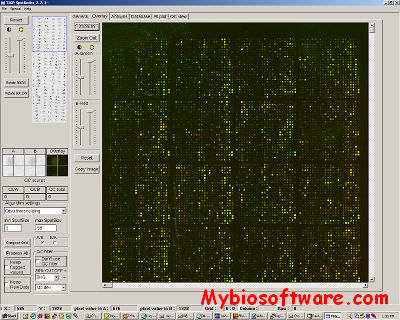
Spotfinder is an image processing program created at The Institute for Genomic Research (J. Craig Venter Institute now) for analysis of the image files generated in microarray expression studies. Spotfinder uses a fast and reproducible algorithm to identify the spots on array and provide quantitation of expression levels.
Image analysis is a crucial step in the microarray process. TIGR Spotfinder was designed for the rapid, reproducible and computer-aided analysis of microarray images and the quantification of gene expression. TIGR Spotfinder reads paired 16-bit or 8-bit TIFF image files generated by most microarray scanners. Semi-automatic grid construction defines the areas of the slide where spots are expected. Automatic and manual grid adjustments help to ensure that each rectangular grid cell is centered on a spot. Two available segmentation methods (histogram and Otsu) define the boundaries between each spot and the surrounding local background. Spot intensities are calculated as an integral of non-saturated pixels, although other options including spot median and mean values are available. Local background subtraction for each reported value is applied by default but can be disabled. The calculated intensities, medians, and means along with each spot position on the array, spot area, background values, and quality control flags are written to a MEV file or the database. Reusable grid geometry files and automatic grid adjustment allow user to analyze large quantities of images in a consistent and efficient manner. To complement the automated methods, particularly in noisy areas of the slide, the user may manually identify or discard spots. Quality control views allow the user to assess systematic biases in the data.
Saeed AI, Sharov V, White J, Li J, Liang W, Bhagabati N, Braisted J, Klapa M, Currier T, Thiagarajan M, Sturn A, Snuffin M, Rezantsev A, Popov D, Ryltsov A, Kostukovich E, Borisovsky I, Liu Z, Vinsavich A, Trush V, Quackenbush J. TM4: a free, open-source system for microarray data management and analysis. Biotechniques. 2003 Feb;34(2):374-8.