SERIAL CLONER 2.6.1 – DNA Cloning, Sequence Analysis & Visualisation

SERIAL CLONER 2.6.1

:: DESCRIPTION

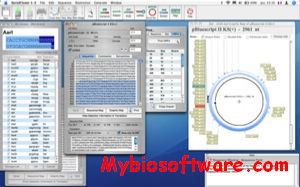
Serial Cloner has been developed to provide a light molecular biology software to both Macintosh and Windows users. Serial Cloner reads and write DNA Strider-compatible files and import and export files in the universal FASTA format. Serial Cloner also import files saved in the Vector NTI, ApE, pDRAW32 and GenBank formats. Import from MacVector is also possible now.  Powerful graphical display tools and simple interfaces help the analysis and construction steps in a very intuitive way. Serial Cloner  handles Annotations and Features both in the sequence and in the Graphic Map.

::DEVELOPER

SerialBasics

:: SCREENSHOTS

:: REQUIREMENTS

  • Linux / Windows / MacOsX

:: DOWNLOAD

SERIAL CLONER

:: MORE INFORMATION

VAMP 2.2.8 – Visualisation and Analysis of CGH arrays, transcriptome and other Molecular Profiles

VAMP 2.2.8

:: DESCRIPTION

The VAMP software (Visualization and Analysis of array-CGH, transcriptome and other Molecular Profiles)allows the visual comparison of the array-CGH profiles of a cohort of patients, or the confrontation of array-CGH, expression and loss of heterozygosity profiles. VAMP offers many functionalities such as computing recurrent alterations, clustering profiles, crossing with clinical or biological annotations, performing syntenic projection onto the genome of another species.

::DEVELOPER

Bioinformatics Laboratory of Institut Curie (Paris).

:: SCREENSHOTS

:: REQUIREMENTS

  • Windows / Linux / Mac OsX
  • Java

:: DOWNLOAD

 VAMP

:: MORE INFORMATION

Citation:

Philippe La Rosa et al.
VAMP: Visualization and analysis of array-CGH, transcriptome and other molecular profiles
Bioinformatics 2006 22: 2066-2073;

iPiG r5 – Integrating PSMs into Genome Browser Visualisations

iPiG r5

:: DESCRIPTION

iPiG targets the integration of peptide spectrum matches (PSMs) from mass spectrometry (MS) peptide identifications into genomic visualisations provided by genome browser such as the UCSC genome browser

::DEVELOPER

iPiG team

: SCREENSHOTS

:: REQUIREMENTS

  • Linux/ Windows/ MacOsX
  • java

:: DOWNLOAD

  iPiG

:: MORE INFORMATION

Citation

iPiG: Integrating Peptide Spectrum Matches Into Genome Browser Visualizations
Mathias Kuhring and Bernhard Y. Renard
PLoS ONE 7(12): e50246. doi:10.1371/journal.pone.0050246

XCrySDen 1.6 – Crystalline & Molecular Structure Visualisation

XCrySDen 1.6

:: DESCRIPTION

XCrySDen (Crystalline Structures and Densities  under the X-Window environment.) is a crystalline and molecular structure visualisation program, which aims at display of isosurfaces and contours, which can be superimposed on crystalline structures and interactively rotated and manipulated.

::DEVELOPER

Anton Kokalj

:: SCREENSHOTS

:: REQUIREMENTS

  • Linux /  MacOsX / Window with Cygwin

:: DOWNLOAD

 XCrySDen

:: MORE INFORMATION

Citation:

A. Kokalj,
Computer graphics and graphical user interfaces as tools in simulations of matter at the atomic scale
Comp. Mater. Sci., 2003, Vol. 28, p. 155.

ZODET 1.0.9 – Identification, Analysis and Visualisation of Outlier Genes in Microarray Expression Data

ZODET 1.0.9

:: DESCRIPTION

ZODET (z-score outlier detection ) is a graphical software package  that enables identification and visualisation of gross abnormalities in gene expression (outliers) in individuals, using whole genome microarray data.

::DEVELOPER

Centre for Molecular Medicine, University College London

:: SCREENSHOTS

:: REQUIREMENTS

  • Windows/ Linux/ MacOsX
  • JRE

:: DOWNLOAD

 ZODET

:: MORE INFORMATION

Citation

ZODET: software for the identification, analysis and visualisation of outlier genes in microarray expression data.
Roden DL, Sewell GW, Lobley A, Levine AP, Smith AM, Segal AW.
PLoS One. 2014 Jan 8;9(1):e81123. doi: 10.1371/journal.pone.0081123

BioLayout 3.4 – Biological Network Visualisation and Analysis

BioLayout 3.4

:: DESCRIPTION

BioLayout is a powerful open-source visual analytics platform designed and developed to aid the interpretation of large and complex biological datasets rendered as network.

::DEVELOPER

BioLayout team 

:: SCREENSHOTS

:: REQUIREMENTS

  • Windows / MacOsX /  Linux
  • Java

:: DOWNLOAD

 BioLayout

:: MORE INFORMATION

Citation

Theocharidis A., van Dongen S., Enright A.J. and Freeman T.C.
Network Visualisation and Analysis of Gene Expression Data using BioLayout Express3D.
Nature Protocols 2009; Vol.4 No.10:1535-50.

Vivaldi – Visualisation, Analysis and Validation of NMR entries

Vivaldi

:: DESCRIPTION

Vivaldi is a web-based service for the analysis, visualization, and validation of NMR structures in the Protein Data Bank (PDB).

::DEVELOPER

Protein Data Bank in Europe

:: SCREENSHOTS

N/A

:: REQUIREMENTS

  • Web browser

:: DOWNLOAD

 NO

:: MORE INFORMATION

Citation

Vivaldi: visualization and validation of biomacromolecular NMR structures from the PDB.
Hendrickx PM, Gutmanas A, Kleywegt GJ.
Proteins. 2013 Apr;81(4):583-91. doi: 10.1002/prot.24213

poRe 0.24 – An R package to enable Visualisation of Nanopore Sequencing data

poRe 0.24

:: DESCRIPTION

poRe (R_poRe) is a package for R that enables users to manipulate, organize, summarise and visualize MinION nanopore sequencing data.

::DEVELOPER

Mick Watson

:: SCREENSHOTS

N/A

:: REQUIREMENTS

  • Windows/Linux/MacOsX
  • R

:: DOWNLOAD

 poRe

:: MORE INFORMATION

Citation

poRe: an R package for the visualization and analysis of nanopore sequencing data.
Watson M, Thomson M, Risse J, Talbot R, Santoyo-Lopez J, Gharbi K, Blaxter M.
Bioinformatics. 2014 Aug 29. pii: btu590.

DNAPlotter 1.11 – Circular & Linear Interactive Genome Visualisation

DNAPlotter 1.11

:: DESCRIPTION

DNAPlotter is a collaborative project between Jemboss and Artemis. It makes use of the existing circular plot in Jemboss and the Artemis sequence libraries.

::DEVELOPER

the Sanger Institute

:: SCREENSHOTS

:: REQUIREMENTS

  • Windows / MacOsX /  Linux
  • Java

:: DOWNLOAD

DNAPlotter

:: MORE INFORMATION

Citation

Carver T, Thomson N, Bleasby A, Berriman M and Parkhill J
DNAPlotter: circular and linear interactive genome visualization.
Bioinformatics (Oxford, England) 2009;25;1;119-20

Exit mobile version