SPANS is an approach to evaluate normalization strategies, which includes the peptide selection component associated with the derivation of normalization values. The approach evaluates the effect of normalization on the between-group variance structure in order to identify the most appropriate normalization methods that improve the structure of the data without introducing bias into the normalized peak intensities.
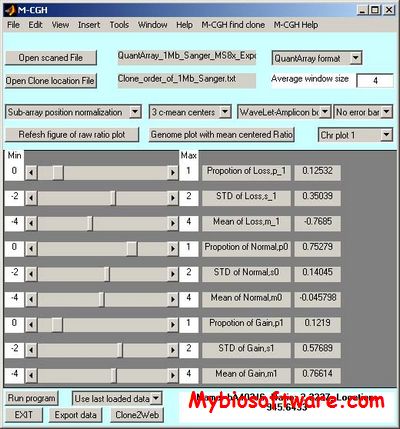
MCGH is a Matlab toolbox with graphical interface to analysis DNA microarray-based comparative genomic hybridization (CGH) experiments. CGH on DNA microarray enable us to measure the copy numbers of thousands of genes through the genome. M-CGH allows us to visualize the copy number changes (amplifications or deletions) and rapidly identify the amplification or deletion regions by directly loading the export file from microarray image analysis package, such as GenePix and QuantArray.
TLM-Tracker (Time-Lapse-Movie-Tracker) is a free platform independent tool for single cell analyses in live-cell imaging experiments like time lapse microscopy. It allows for the flexible and user friendly segmentation, tracking and lineage analysis of microbial cells in time-lapse movies.
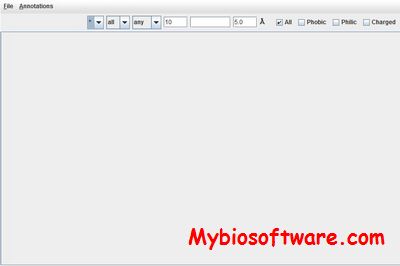
AMINONET is a Java-based software tool to construct different protein contact networks (unweighted and weighted; long range, short range and any range; hydrophobic, hydrophilic, charged or all-amino-acid networks). The networks thus constructed can be visualized. The software will also help in the calculation of the values of the different topological parameters of the constructed networks.
INSEGT is a tool to analyse alignments of RNA-Seq reads (single-end or paired-end) by using gene annotations. It can measure exon, transcript and gene expression levels of given annotations. If read alignments span more than one exon, INSEGT can also compute possible exon combinations (tuple) and their expression levels. According to requirements it computes maximal tuple or tuple with a certain length. For paired-end reads INSEGT builds also tuple, whose exons are connected by matepairs. Briefly it searches the intervals of the read alignments in the intervals of the given annotations. It counts the mapped reads for each annotation and its parent annotation and stores the mapped annotations for each read.
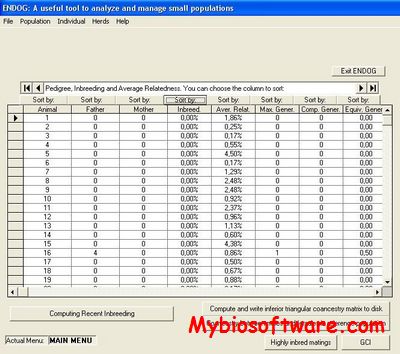
ENDOG‘s Primary functions are the computation of the individual inbreeding (F) (Wright, 1931) and the average relatedness (AR) (Gutiérrez et al., 2003; Goyache et al., 2003) coefficients. Additionally, users can compute with ENDOG useful parameters in population genetics such as that described for Biochard et al. (1997) for the number of ancestors explaining genetic variability or those proposed by Robertson (1953) and Vassallo et al. (1996) for the genetic importance of the herds. ENDOG also can compute F statistics (Wright, 1978) from genealogical information following Caballero and Toro (2000; 2002). Moreover, the present version of ENDOG calculates effective population size following different methodologies including regression approaches and particularly the recently proposed realized effective population size from individual increase in inbreeding (Gutiérrez et al., 2008), modified to account for avoidance of self-fertilization (Gutiérrez et al., 2009).
BioQuali analyses regulatory networks and expression datasets by checking a global consistency between the regulatory model and the expression data. It diagnoses a regulatory network searching for the regulations that are not consistent with the expression data, and it outputs a set of genes which predicted expression is decided in order to explain the expression data provided.