ProSeqViewer 1.0.42 – Visualize Sequence and Multiple Sequence Alignment (MSA)

ProSeqViewer 1.0.42

:: DESCRIPTION

ProSeqViewer is a TypeScript library to visualize annotation on single sequences and multiple sequence alignments.

::DEVELOPER

The BioComputing UP lab

:: SCREENSHOTS

:: REQUIREMENTS

  • Linux / Windows
  • JS

:: DOWNLOAD

ProSeqViewer

:: MORE INFORMATION

Citation:

Bevilacqua M, Paladin L, Tosatto SCE, Piovesan D.
ProSeqViewer: an interactive, responsive and efficient TypeScript library for visualization of sequences and alignments in web applications.
Bioinformatics. 2021 Nov 12:btab764. doi: 10.1093/bioinformatics/btab764. Epub ahead of print. PMID: 34788797.

Dendroscope 3.7.6 – Visualize Phylogenetic Trees & Rooted Networks

Dendroscope 3.7.6

:: DESCRIPTION

Dendroscope is a software for the interactive visualization and navigation of phylogenetic trees. The program provides all standard tree visualizations and is optimized to run interactively on trees containing hundreds of thousands of taxa. The program provides tree editing and graphics export capabilities. To support the inspection of large trees, Dendroscope offers a magnification tool.

::DEVELOPER

the Algorithms in Bioinformatics lab.

:: SCREENSHOTS

:: REQUIREMENTS

  • Windows / MacOsX / Linux
  • Java

:: DOWNLOAD

Dendroscope

:: MORE INFORMATION

Citation:

Daniel H Huson, Daniel C Richter, Christian Rausch, Tobias Dezulian, Markus Franz and Regula Rupp.
Dendroscope: An interactive viewer for large phylogenetic trees,
BMC Bioinformatics. 2007 Nov 22;8(1):460

LCR-eXXXplorer – Search, Visualize and Share data for low Complexity Regions in Protein sequence

LCR-eXXXplorer

:: DESCRIPTION

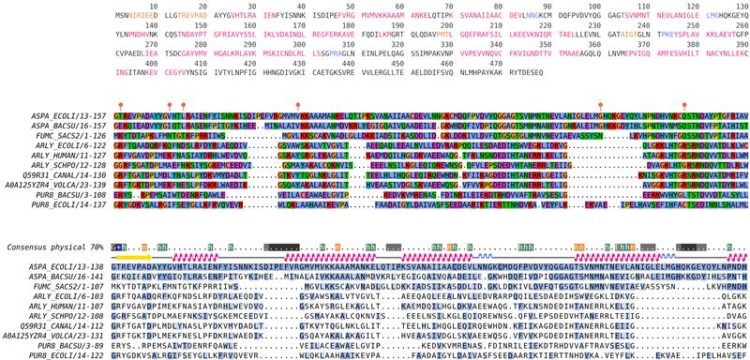
LCR-eXXXplorer is a web-service designed to assist biologists in displaying, searching and sharing Low Complexity Regions (LCRs) contained within protein sequences.

::DEVELOPER

LCR-eXXXplorer team

:: SCREENSHOTS

N/A

:: REQUIREMENTS

  • Web browser

:: DOWNLOAD

 NO

:: MORE INFORMATION

Citation:

LCR-eXXXplorer: a web platform to search, visualize and share data for low complexity regions in protein sequences.
Kirmitzoglou I, Promponas VJ.
Bioinformatics. 2015 Feb 20. pii: btv115.

VitaPad 0.6.1c – Visualize and Analyze Biological Pathways

VitaPad 0.6.1c

:: DESCRIPTION

VitaPad is an application used to visualize biological pathways and map experimental data to them

::DEVELOPER

Zhao Hongyu’s Lab

:: SCREENSHOTS

:: REQUIREMENTS

  • Windows/ Linux/MacOsX
  • Java

:: DOWNLOAD

  VitaPad

:: MORE INFORMATION

Citation

VitaPad: visualization tools for the analysis of pathway data.
Holford M, Li N, Nadkarni P, Zhao H.
Bioinformatics. 2005 Apr 15;21(8):1596-602. Epub 2004 Nov 25.

clusterMaker2 1.3.1 – Creat and Visualize Cytoscape Clusters

clusterMaker2 1.3.1

:: DESCRIPTION

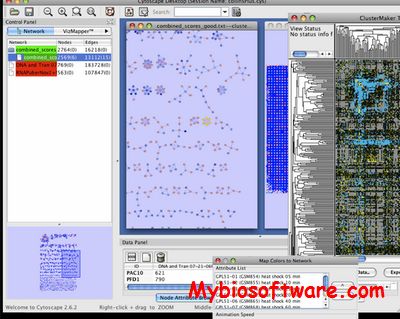
UCSF clusterMaker is a Cytoscape plugin that unifies different clustering techniques and displays into a single interface. Current clustering algorithms include hierarchical, k-medoid, AutoSOME, and k-means for clustering expression or genetic data; and MCL, transitivity clustering, affinity propagation, MCODE, community clustering (GLAY), SCPS, and AutoSOME for partitioning networks based on similarity or distance values. Hierarchical, k-medoid, AutoSOME, and k-means clusters may be displayed as hierarchical groups of nodes or as heat maps. All of the network partitioning cluster algorithms create collapsible “meta nodes” to allow interactive exploration of the putative family associations within the Cytoscape network, and results may also be shown as a separate network containing only the intra-cluster edges, or with inter-cluster edges added back

::DEVELOPER

the Resource for Biocomputing, Visualization, and Informatics (RBVI) at UCSF

:: SCREENSHOTS

:: REQUIREMENTS

:: DOWNLOAD

 clusterMaker

:: MORE INFORMATION

Citation:

clusterMaker: a multi-algorithm clustering plugin for Cytoscape.
Morris JH, Apeltsin L, Newman AM, Baumbach J, Wittkop T, Su G, Bader GD, Ferrin TE.
BMC Bioinformatics. 2011 Nov 9;12:436. doi: 10.1186/1471-2105-12-436.

FISH Oracle 2 – Visualize Data from multiple Array CGH or SNP Array Experiments

FISH Oracle 2

:: DESCRIPTION

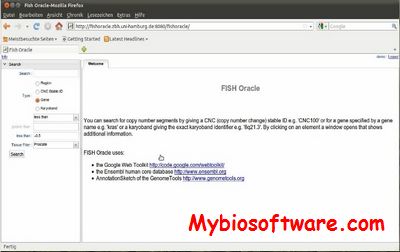
FISH Oracle is a web-based software to visualize data from multiple array CGH or SNP array experiments in a genomic context. Its fast visualization engine and advanced web and database technology supports highly interactive use. FISH Oracle comes with a convenient data import mechanism, powerful search options for genomic elements (like gene names or karyobands), quick navigation and  zooming into interesting regions, and mechanisms to export the visualization into different high quality image formats (PDF, PS, PNG, SVG).

::DEVELOPER

RESEARCH GROUP FOR GENOME INFORMATICS ,Center for Bioinformatics, University of Hamburg

:: SCREENSHOTS

:: REQUIREMENTS

  • Linux / MacOsX
  • MySQL
  • Java
  • Apache Tomcat server
  • GenomeTools

:: DOWNLOAD

  FISH Oracle

:: MORE INFORMATION

Citation

M. Mader, R. Simon, S. Steinbiss and S. Kurtz:
FISH Oracle: a web server for flexible visualization of DNA copy number data in a genomic context.
Journal of Clinical Bioinformatics, 1:20 (2011)

InterViewer 4.0 – Visualize Large-scale Protein Interaction Networks

InterViewer 4.0

:: DESCRIPTION

InterViewer is a software for visualizing large-scale protein interaction networks. InterViewer  (1) first finds a layout of connected components of an entire network, (2) finds a global layout of nodes with respect to pivot nodes within a connected component, and (3) refines the local layout of each connected component by first relocating midnodes with respect to their cutvertices and direct neighbors of the cutvertices and then by relocating all nodes with respect to their neighbors within distance 2. Advantages of InterViewer over classical graph drawing methods include: (1) it is an order of magnitude faster, (2) it can directly visualize data from protein interaction databases, and (3) it provides several operations for effectively exploring large-scale protein interaction networks.

::DEVELOPER

Biocomputing Lab. School of Computer Science and Engineering Inha University, Inchon

:: SCREENSHOTS

:: REQUIREMENTS

  • Windows / MacOsX / Linux
  • Java

:: DOWNLOAD

InterViewer

:: MORE INFORMATION

Citation

Byong-Hyon Ju, Byungkyu Park, Jong H. Park and Kyungsook Han
Visualization and analysis of protein interactions
Bioinformatics (2003) 19 (2): 317-318.

GenomeStudio 2.0.5 – Visualize and Analyze data generated by all of Illumina’s platform

GenomeStudio 2.0.5

:: DESCRIPTION

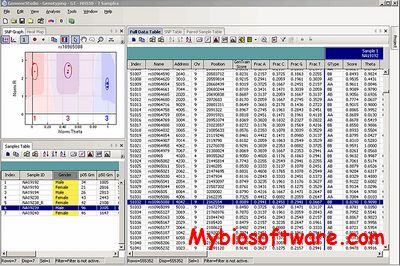
GenomeStudio is a software to visualize and analyze data generated by all of Illumina’s platform.This powerful informatics solution supports the primary analysis of sequence-based data produced by the Genome AnalyzerIIx and microarray-based data generated by the iScan System. Performance optimized tools and a user-friendly graphical interface allow you to quickly and easily convert data into meaningful results for your genome analysis and research.

::DEVELOPER

Illumina

:: SCREENSHOTS

:: REQUIREMENTS

  • Windows

:: DOWNLOAD

 GenomeStudio

:: MORE INFORMATION

Citation

Methods Mol Biol. 2011;784:77-98. doi: 10.1007/978-1-61779-289-2_6.
Gene expression profiling in formalin-fixed, paraffin-embedded tissues using the whole-genome DASL assay.
April CS, Fan JB.

Exit mobile version