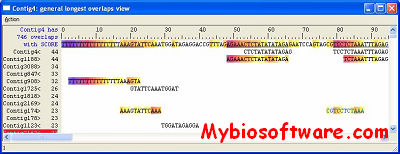
VIZARD is a Java program for analysis and visualization of Affymetrix GeneChip® data.VIZARD includes several integrated tools for filtering, sorting, clustering and visualization of gene expression data as well as tools for discovery of regulatory motifs in upstream sequences. It also includes annotation and upstream sequence databases for the majority of genes represented on the Affymetrix Arabidopsis 8K GeneChip® array.
When VIZARD was created its name originated from VIsualiZe microARray Data. Now it does much more than visualization of gene expression data, however, we have decided to keep the name.
It is available free of charge for educational, research, and not-for-profit purposes. To read full text of the terms under which the program is distributed, click here.
Picky is an oligo design program that alleviates long and monotonous calculations by identifying probes that are very unique and specific to sequence regions. These calculations are based on parameters inputted by the user including optimal probe length, ideal percentage of guanine and cytosine content, salt concentration and the maximum length to which a target sequence matches any non-target sequence.
PICKY allows the rapid and efficient determination of gene-specific oligos based on given gene sets, and can be used for large, complex genomes such as human, mouse, or maize. PICKY can also be used to analyze existing microarray probes and evaluate their design quality. Because PICKY uses rigorous whole genome-based thermodynamic screening to identify potential hydrogen binding sites of each probe, it can also be utilized to design short interference RNA (siRNA) for gene knockout applications and to discover possible targets of regulatory short RNAs (e.g., microRNAs or sRNAs). Picky has exceptional computational capability and is also user friendly.
If you find Picky useful to your research, please cite the Picky papers below that are most relevant to your work. If you have no preference, we recommend you cite the newest Shared Probe Design paper.
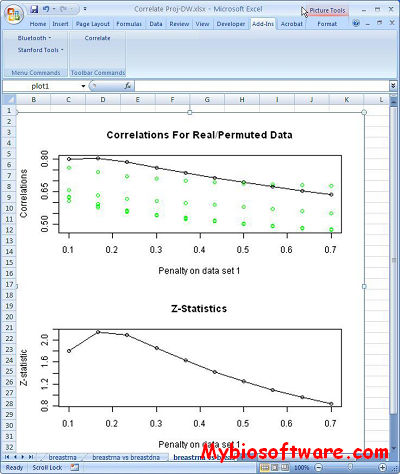
Correlate is an Excel plug-in for performing an integrative analysis of two genomic data sets.
If two sets of assays (e.g. gene expression and DNA copy number) have been performed on the same set of patient samples then sparse CCA can be used to find a set of variables in assay 1 that is maximally correlated with a set of variables in assay 2.
::DEVELOPER
Sam Gross / Balasubramanian Narasimhan / Robert Tibshirani /Daniela Witten
ENIGMA – Expression Network Inference and Global Module Analysis. It is a software tool to analyze the modular structure of perturbational gene expression data, based on the use of combinatorial statistics and graph-based clustering. The modules are further characterized by incorporating other data types, e.g. GO annotation, protein interactions and transcription factor binding information, and by suggesting regulators that might have an effect on the expression of (some of) the genes in the module.
Steven Maere, Patrick Van Dijck, Martin Kuiper (2008) Extracting expression modules from perturbational gene expression compendia. BMC Systems Biology 2:33 (PubMed, BMC)
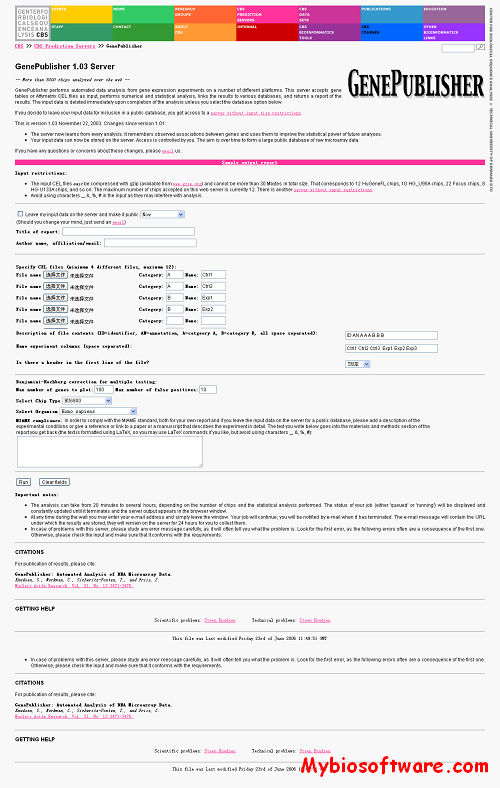
GenePublisher performs automated data analysis from gene expression experiments on a number of different platforms. This server accepts gene tables or Affymetrix CEL files as input, performs numerical and statistical analysis, links the results to various databases, and returns a report of the results. The input data is deleted immediately upon completion of the analysis unless you select the database option below.
::DEVELOPER
CBS (Center for Biological Sequence Analysis) at Technical University of Denmark
:: SCREENSHOTS
:: REQUIREMENTS
web browser
:: MORE INFORMATION
Input restrictions:
The input CEL files must be compressed with gzip (available from www.gzip.org) and cannot be more than 30 Mbytes in total size. That corresponds to 12 HuGeneFL chips, 10 HG_U95A chips, 22 Focus chips, 8 HG-U133A chips, and so on. The maximum number of chips accepted on this web server is currently 12. There is another server without input restrictions.
Avoid using characters _, &, %, # in the input as they may interfere with analysis.
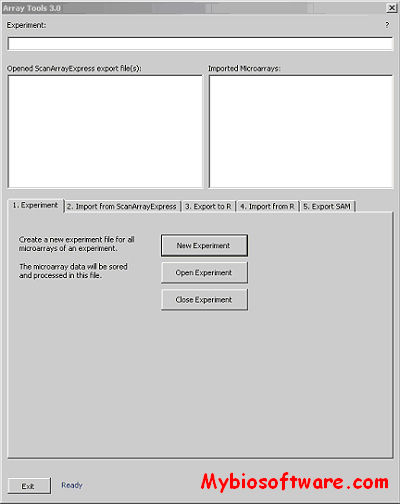
Array Tools is a Microsoft Excel Add-In, which is designed to handle the import and export of Dictyostelium discoideum microarray data. It can be used to:
Import ScanArray Express CSV to Excel.
Export the data to R by creating Data.spot, R Commands. R and Arrays.txt files.
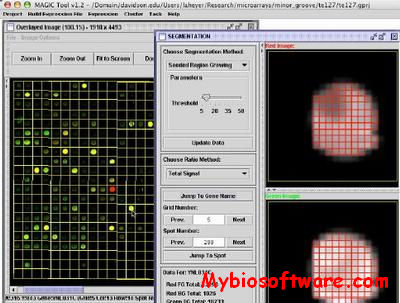
MAGIC Tool is an integrated microarray data analysis software.
The purpose of MAGIC Tool is to allow the user to begin with DNA microarray tiff files and end with biologically meaningful information. Comparative hybridization data (glass chips) and Affymetrix data are compatible with MAGIC Tool. You can start with tiff files or expression files.
MAGIC Tool allows the user to change parameters for clustering, data quantification etc.
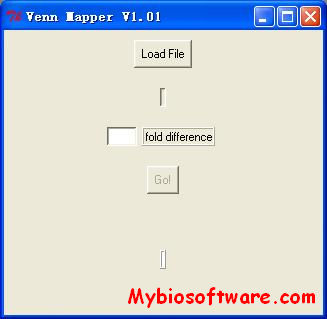
Venn Mapper is a program that cluster heterologous microarray data based on the number of co-occurring differentially expressed genes. The application loads microarray data (gene expression ratios) and determines which genes are up- or down-regulated by a user-defined ratio cut-off level. For each experiment, lists of differentially expressed genes are computed. Every list will be compared to every other list, and the number of co-occurring genes will be calculated. With the use of the binomial distribution, so called z-values can be assigned to the overlap found between two lists. The z-values can be directly imported into the Cluster and/or TreeView software.
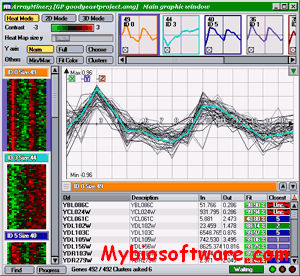
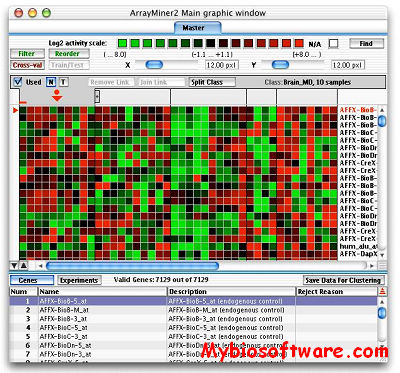
ArrayMiner® is a set of analysis tools using advanced algorithms to reveal the true structure of your gene expression data. Its unique graphical interface gives you an intimate understanding of the analysis and an easy publishing of its results.
ArrayMiner include clustering module & classmarking module.
In order to be eligible for the free light version, your institution must be academic. The light version is limited to 500 genes and 10 experiments for the clustering module and 500 genes for the ClassMarker tool. The light licence’s validity is 1 year.
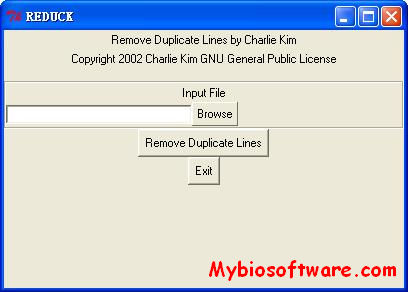
REDUCK removes duplicate lines from a PCL file. Actually, it removes duplicate lines from any text file, but was intended for use with PCL files. Does exactly what it says; if the lines are not 100% identical, they are not removed.