NACK averages data values for a PCL file, but only if the Name (second) column is identical. Intended for averaging data values when multiple spots are present on a single array for a given gene.
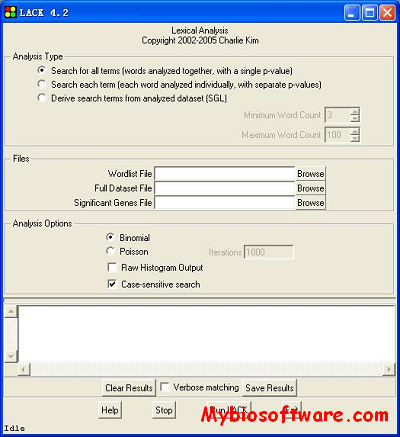
LACK addresses whether or not a theme is actually overrepresented in your significant genes list. The program takes a list of significant genes and a list of user-specified search terms, and counts the number of genes which contain one of the search terms. Then, the program takes a random set of genes of the same size as the significant set from a genome annotation file and counts the hits. This process is repeated a user-specified number of times so that statistics regarding the randomness of the frequencies can be calculated. Statistics and histogram data is output to a text file.
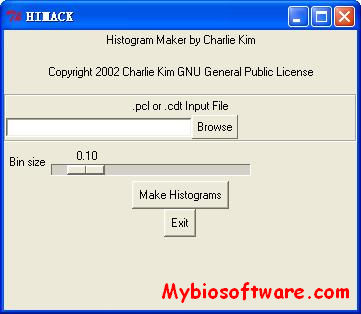
HIMACK takes an input PCL or CDT file and generates a graphical histogram file in JPEG format. Allows rapid stimultaneous viewing of histograms for multiple datasets for quality assessment. Primarily intended for DNA and RNA hybridizations.
GODACK is a simple filtering tool which demands that a certain percentage of datapoints be present in a PCL file. Spots which fail to contain the user-specified percentage of good data points are removed from the dataset.
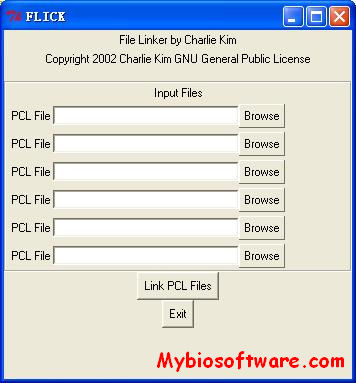
FLICK takes multiple PCL files and creates a single aggregate PCL file.FLICK is written in perl.
Intended for joining datasets which have been created on separate occassions, and which may have different ID values (normally requiring the creation of a database to join the data fields).
CCACK takes an input PCL or CDT (pre- or post-clustering) file and converts all values to a binary scale. CCACK is written in perl. The cutoff is user-defined. Primarily intended for genomotyping analysis. Also see GACK below.
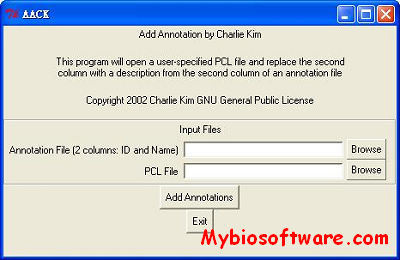
AACK adds annotation from a file to a PCL (pre-clustering) data file. AACK is written in perl.
The annotation file requires an ID and Name column. The ID’s are read from the first column of the PCL file, and the annotations are added to the second column. Does not affect the data. Intended for situations in which a different annotation is desired, such as when an annotation is published for a microarray constructed pre-annotation.
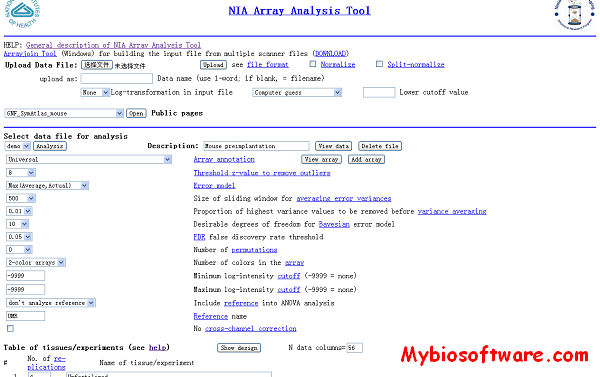
NIA Array Analysis Tool is designed to test statistical significance of gene microarray data, visualize the results, and provide links to clone information and gene index.
Evaluate the statistical significance of differential gene expression based on microarray data
Make log-ratio plots and scatter-plots
Find clusters of tissues with similar expression patterns and identify specific genes for each cluster
Find major patterns of variability in gene expression using Principal Component Analysis (PCA) and biplot
Cluster genes according to their contribution to principal components
Find genes whose expression matches a given pattern (pattern matching)
Plot the dendrogram for replications to check abnormal arrays
Plot the error function (SD vs. expression level)
Make a correlation matrix
Normalize input data
Import principal components from an earlier analysis to overlay 2 sets of results
Save results of analysis for personal or public access
Arrayjoin Tool is designed for compiling an input file from multiple scanner files.
ANOVA Tool – Statistical analysis is based on the single-factor ANalysis Of VAriance
Hierarchical clustering of tissues is done using the average distance method.
Principal component analysis (PCA) is done using the Singular Value Decomposition (SVD) method that generates eigenvectors both for rows and columns of the log-transformed data matrix (Gabriel 1971.
Pattern matching can be used to find genes with expression pattern similar to some other gene (or group of genes).
Gene list analysis – Getting information on selected genes is one of most important components of microarray analysis.