Circos is a software package for visualizing genome data and information. It visualizes data in a circular layout — this makes Circos ideal for exploring relationships between objects or positions.
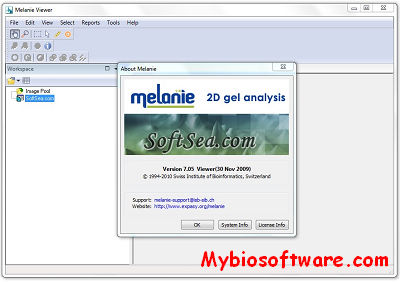
Melanie Viewer is made available free of charge to help researchers visualize gels and related data obtained through the use of the full version of Melanie by colleagues. It can also be used to view annotated gels from databases such as SWISS-2DPAGE, or any other image files with an appropriate format (.tif, .gel, …).
NAViGaTOR (Network Analysis, Visualization, & Graphing TORonto ) is a software package for visualizing and analyzing protein-protein interaction networks.NAViGaTOR can query OPHID / I2D – online databases of interaction data – and display networks in 2D or 3D. To improve scalability and performance, NAViGaTOR combines Java with OpenGL to provide a 2D/3D visualization system on multiple hardware platforms. NAViGaTOR also provides analytical capabilities and supports standard import and export formats such as GO and the Proteomics Standards Initiative (PSI).
GsmPlot is a web service to automatically download, analyze and visualize epigenetics data (ChIP-Seq, ATAC-Seq, Bis-Seq), public from NCBI or private from you.
KGML-ED supports the dynamic exploration and editing of KEGG Pathway diagrams. It is a graphical network editor, that provides read- and write-support for the KGML (KEGG Markup Language) file format. Pathway files are loaded and transformed into a graph network which may be modified to fulfill user-specific needs (e.g. it is possible, to delete or add network elements, change labels and colors). Novel network exploration approaches are supported by the system as well.
Circoletto is a rather beautiful way to visualise sequence similarity from BLAST results (which you can either create through Circoletto, or upload your own).
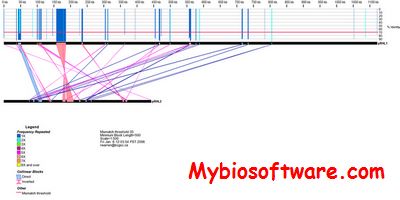
Haploscope is a software package that facilitates flexible rendering of images to aid interpretation of model-based summaries of population haplotypes. Haploscope is designed to accept haplotype frequency input directly from output files of fastPHASE (Scheet & Stephens, 2006), though output from other cluster-based models for population haplotypes could be adapted for input to Haploscope.