Osprey 1.2.0 – Protein-protein Interaction Networks Visualization System

Osprey 1.2.0

:: DESCRIPTION

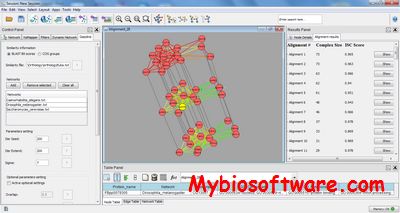
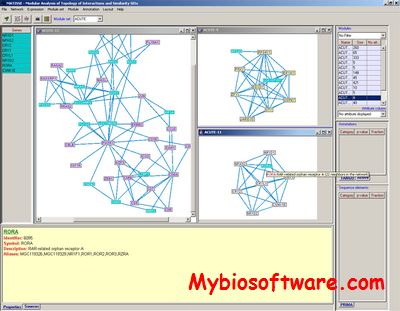
Osprey is a tool for visualization and manipulation of complex interaction networks. Osprey builds data-rich graphical representations that are color-coded for gene function and experimental interaction data. Mouse-over functions allow rapid elaboration and organization of network diagrams in a spoke model format. User-defined large-scale data sets can be readily combined with Osprey for comparison of different methods.

::DEVELOPER

Osprey Partners

:: SCREENSHOTS

:: REQUIREMENTS

:: DOWNLOAD

Osprey

:: MORE INFORMATION

Citation

Osprey: a network visualization system.
Breitkreutz BJ, Stark C, Tyers M.
Genome Biol. 2003;4(3):R22. Epub 2003 Feb 27.

PyInteraph 1.0 – Analysis of Interaction Networks in Structural Ensembles of Proteins

PyInteraph 1.0

:: DESCRIPTION

The PyInteraph software suite is a package designed to analyze intra- or inter-molecular interactions in structural ensembles derived both from molecular simulations or experiments (i.e. NMR-based structural ensembles)

::DEVELOPER

PyInteraph team

:: SCREENSHOTS

N/A

:: REQUIREMENTS

  • Linux
  • Python

:: DOWNLOAD

 PyInteraph

 :: MORE INFORMATION

Citation

J Chem Inf Model. 2014 Apr 17. [Epub ahead of print]
PyInteraph: A Framework for the Analysis of Interaction Networks in Structural Ensembles of Proteins.
Tiberti M1, Invernizzi G, Lambrughi M, Inbar Y, Schreiber G, Papaleo E.

GAIN 0.2.0 – Genetic Association Interaction Network tool

GAIN 0.2.0

:: DESCRIPTION

GAIN is based on interaction information between three attributes; in this case, between two single nucleotide polymporphisms (SNPs) and a class or phenotype attribute. Interaction information is the gain in phenotype information obtained by considering SNP A and SNP B jointly beyond the phenotype information that would be gained by considering SNPs A and B independently.

::DEVELOPER

Insilico Research Group (McKinney Laboratory for Bioinformatics and In Silico Modeling)

:: SCREENSHOTS

N/A

:: REQUIREMENTS

  • Linux / Windows/ MacOsX
  • Python

:: DOWNLOAD

 GAIN

:: MORE INFORMATION

Citation

PLoS Genet. 2009 Mar;5(3):e1000432. doi: 10.1371/journal.pgen.1000432. Epub 2009 Mar 20.
Capturing the spectrum of interaction effects in genetic association studies by simulated evaporative cooling network analysis.
McKinney BA1, Crowe JE, Guo J, Tian D.

NAViGaTOR 3.0 – Visualize and Analyze Protein-protein Interaction Networks.

NAViGaTOR 3.0

:: DESCRIPTION

NAViGaTOR (Network Analysis, Visualization, & Graphing TORonto ) is a software package for visualizing and analyzing protein-protein interaction networks.NAViGaTOR can query OPHID / I2D – online databases of interaction data – and display networks in 2D or 3D. To improve scalability and performance, NAViGaTOR combines Java with OpenGL to provide a 2D/3D visualization system on multiple hardware platforms. NAViGaTOR also provides analytical capabilities and supports standard import and export formats such as GO and the Proteomics Standards Initiative (PSI).

::DEVELOPER

Jurisica Lab of the Ontario Cancer Institute

:: SCREENSHOTS

:: REQUIREMENTS

  • Windows / Linux / Mac OsX
  • Java

:: DOWNLOAD

 NAViGaTOR

:: MORE INFORMATION

Citation

Bioinformatics. 2009 Dec 15;25(24):3327-9. doi: 10.1093/bioinformatics/btp595. Epub 2009 Oct 16.
NAViGaTOR: Network Analysis, Visualization and Graphing Toronto.
Brown KR1, Otasek D, Ali M, McGuffin MJ, Xie W, Devani B, Toch IL, Jurisica I.

Djebbari, A., Ali, M., Otasek, D., Kotlyar. M., Fortney, K., Wong, S., Hrvojic, A. and Jurisica, I.
NAViGaTOR: Scalable and Interactive Navigation and Analysis of Large Graphs.
Internet Mathematics, 7(4):314-347, 2011

PathExpand – Extending Cellular Pathways in Interaction Networks

PathExpand

:: DESCRIPTION

PathExpand is a methodology for extending pre-defined protein sets representing cellular pathways and processes by mapping them onto a protein-protein interaction network, and expanding them to include densely interconnected interaction partners.

::DEVELOPER

PathExpand team

:: SCREENSHOTS

N/A

:: REQUIREMENTS

  • Web Browser

:: DOWNLOAD

 NO

:: MORE INFORMATION

Citation:

E. Glaab, A. Baudot, N. Krasnogor, A. Valencia
Extending pathways and processes using molecular interaction networks to analyse cancer genome data
in BMC Bioinformatics, 11(1):597, 2010

DynaSIN – The Dynamic Structure Interaction Network

DynaSIN

:: DESCRIPTION

DynaSIN is a resource for studying protein-protein interaction networks in the context of conformational changes.

::DEVELOPER

Gerstein Lab

:: SCREENSHOTS

N/A

:: REQUIREMENTS

  • Web browser

:: DOWNLOAD

NO

:: MORE INFORMATION

Citation:

Protein Sci. 2011 Oct;20(10):1745-54. doi: 10.1002/pro.710.
Integration of protein motions with molecular networks reveals different mechanisms for permanent and transient interactions.
Bhardwaj N1, Abyzov A, Clarke D, Shou C, Gerstein MB.

GASOLINE 2.0 – Optimal Local multiple Alignment of Interaction NEtworks

GASOLINE 2.0

:: DESCRIPTION

GASOLINE (Greedy and Stochastic Algorithm for Optimal Local alignment of Interaction Networks) is an algorithm for multiple local network alignment based on statistical iterative sampling in connection to a greedy strategy. GASOLINE can produce biologically significant alignments in reasonable running time, even for very large input instances.

::DEVELOPER

Giovanni Micale

:: SCREENSHOTS

:: REQUIREMENTS

  • Linux / Windows/ MacOsX
  • CytoScape
  • JRE

:: DOWNLOAD

 GASOLINE

:: MORE INFORMATION

Citation:

Micale G, Pulvirenti A, Giugno R, Ferro A (2014)
GASOLINE: a Greedy And Stochastic algorithm for Optimal Local multiple alignment of Interaction NEtworks.
PLoS ONE 9(6): e98750. doi: 10.1371/journal.pone.0098750

MATISSE 1.1 – Detection of Functional Modules using Interaction Networks and Expression data

MATISSE 1.1

:: DESCRIPTION

MATISSE (Module Analysis via Topology of Interactions and Similarity SEts) is a program for detection of functional modules using interaction networks and expression data. A functioncal module is a group of cellular components and their interactions that can be attributed a specific biological function.

::DEVELOPER

Ron Shamir’s lab

:: SCREENSHOTS

::REQUIREMENTS

  • Windows/Linux
  • Java

:: DOWNLOAD

 MATISSE

:: MORE INFORMATION

Citation

Identification of functional modules using network topology and high-throughput data
I. Ulitsky and R. Shamir
BMC Systems Biology, Vol. 1, No. 8 (2007)

TRRUST v2 – Curated TF-target Interaction Networks in Human and Mouse

TRRUST v2

:: DESCRIPTION

TRRUST (Transcriptional Regulatory Relationships Unraveled by Sentence-based Text mining) is a manually curated database of human and mouse transcriptional regulatory networks.

::DEVELOPER

Network Biomedicine Laboratory at Yonsei University, Korea

:: SCREENSHOTS

N/A

:: REQUIREMENTS

  • Web browser

:: DOWNLOAD

 NO

:: MORE INFORMATION

Citation

TRRUST v2: an expanded reference database of human and mouse transcriptional regulatory interactions.
Han H, et al.
Nucleic Acids Res. 2018 Jan 4;46(D1):D380-D386. doi: 10.1093/nar/gkx1013.

CellWhere 2019.10 – Graphical Display of Interaction Networks organized on Subcellular Localizations

CellWhere 2019.10

:: DESCRIPTION

CellWhere is a data combining and visualization tool that enables bench researchers to quickly explore the reported subcellular locations of a list of genes/proteins, and to put these subcellular locations into the context of previously identified physical interactions that could be occurring between these proteins and others within the cell.

::DEVELOPER

CellWhere team

:: SCREENSHOTS

N/A

:: REQUIREMENTS

  • WEb browser

:: DOWNLOAD

 NO

:: MORE INFORMATION

Citation:

CellWhere: graphical display of interaction networks organized on subcellular localizations.
Zhu L, Malatras A, Thorley M, Aghoghogbe I, Mer A, Duguez S, Butler-Browne G, Voit T, Duddy W.
Nucleic Acids Res. 2015 Apr 16. pii: gkv354.

Exit mobile version